Purpose
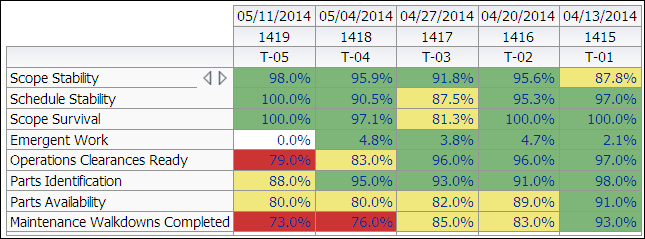
The pivot table shows how Key Performance Indicators (KPIs) are performing from a planning perspective in the upcoming execution work weeks. The percentages shown are color coded to highlight where improvement needs to be made. Green shaded percentages are good, yellow highlights potential issues, and red indicates where corrective action might be needed. The thresholds that determine when an issue is green, yellow, or red are customizable. The KPIs are based on INP0 AP-928 standards, which are used by the United States nuclear power utility industry. The last four KPIs shown are based on custom activity codes.
The columns show execution workweek start dates, workweeks, and workweek indicators (from T-05 to T-01, T-01 being next week and T-05 being five weeks in the future).
Note: The workweek is often used in the nuclear industry. This is determined by taking the last two digits of the year and attaching the week number to the end. For example, the 22nd week of 2013 would have a Workweek number of 1322 and the 23rd week would be 1323.
The rows show:
- Scope Stability
- Schedule Stability
- Scope Survival
- Emergent Work
- Operations Clearances Ready
- Parts Identification
- Parts Availability
- Maintenance Walkdowns Completed
Click on a cell to drill down to activities.
Location
- On the Home page, click Dashboards.
- Under Primavera, select Industry Standards.
- On the Industry Standards dashboard, click the Routine/On-Line Maintenance page.
- On the Routine/On-Line Maintenance page, expand the Work Planning Look Ahead section.
Subject Area
Work Planning