Purpose
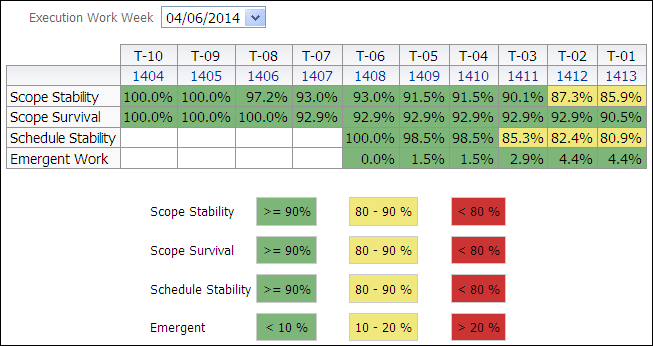
The pivot table shows a historical perspective of a particular execution work week, shown in the table as T-00. The table allows you to see how specific Key Performance Indicators (KPIs) performed week after week. The table shows the percentages for T-10 through T-00, T-10 being 10 weeks before the execution work week.
Cells are color coded per KPI to show whether the values represent good performance or indicate that corrective work should considered or is urgently required.
The columns show execution workweek indicators (from T-10 to T-00) and workweeks.
Note: The workweek is often used in the nuclear industry. This is determined by taking the last two digits of the year and attaching the week number to the end. For example, the 22nd week of 2013 would have a Workweek number of 1322 and the 23rd week would be 1323.
The rows show:
- Scope Stability
- Scope Survival
- Schedule Stability
- Emergent Work
Use the Execution Work Week list to change to view a different week's history.
Location
- On the Home page, click Dashboards.
- Under Primavera, select Industry Standards.
- On the Industry Standards dashboard, click the Routine/On-Line Maintenance page.
- On the Routine/On-Line Maintenance page, expand the Work Planning T+1 Critique section.
Subject Area
Work Planning