- sys_workdown_date: 3/31/2013
- Data Date: 4/01/2013
- ETL Process Date: 4/01/2013 11:59 p.m.
On Day 1, three activities are marked complete, leaving only two activities remaining. The Data Date is then updated accordingly. At the time the ETL process is run, the actuals are captured from the schedule in the Burn Down.
Schedule Updates
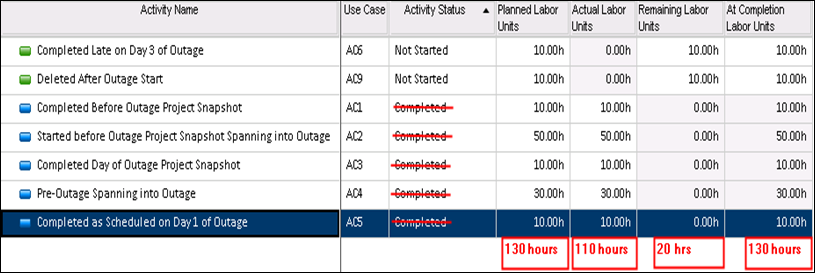
- Started before Outage Project Snapshot Spanning into Outage - AC2
- Status: Complete
- Actual Units: 50 (2 today)
- Remaining Units: 0
- Pre-Outage Work Spanning into Outage - AC4
- Status: Complete
- Actual Units: 30 (6 today)
- Remaining Units: 0
- Completed as Schedule on Day 1 of Outage - AC5
- Status: Complete
- Actual Units: 10
- Remaining Units: 0
Burn Down Hours
Burn Down Hours Summary
- 20 Baseline Hours remain
- 20 Actual Hours remain
- 130 Total Hours (Actual and Remaining)
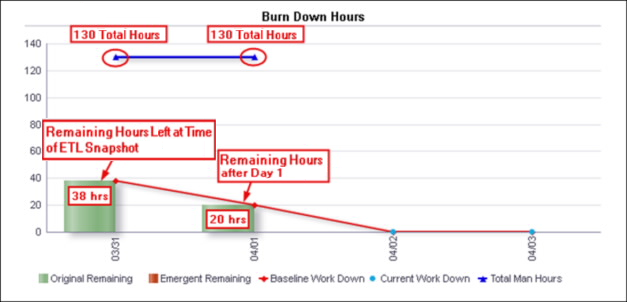
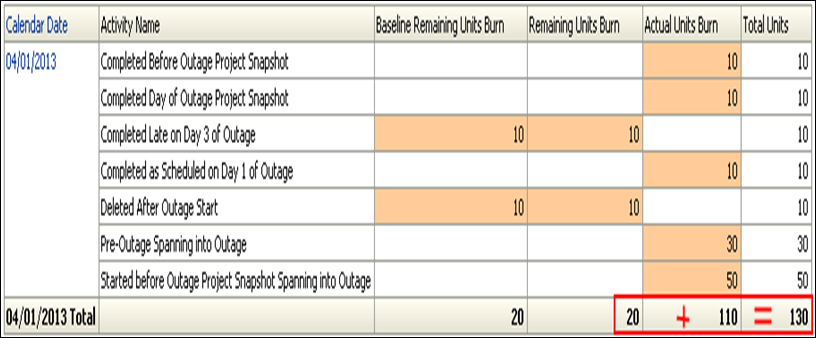
At the time the ETL process is run on 4/01/2013 there are 20 hours remaining in the schedule. As all the activities still match the plan on 3/31/2013, there are 130 Total Hours, which is a combination of the Actual Units Burn and Remaining Units Burn.
The table shows a subset of the activity metrics that are summarized in the Burn Down Hours line-bar chart for Day 1.
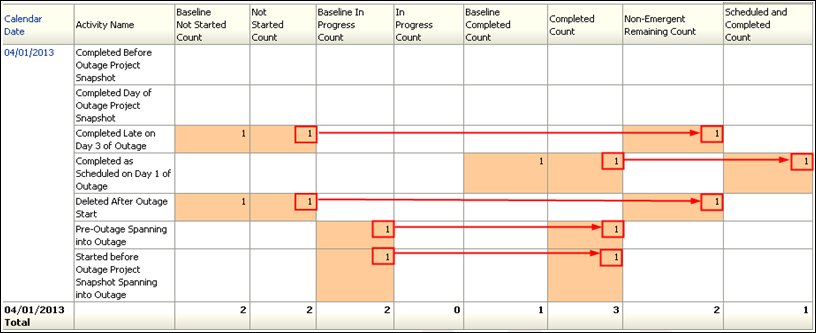
Burn Down Counts
Burn Down Counts Summary
- 2 Baseline Activities remain
- 2 Actual Activities remain
- 6 Total Activities (Complete and Remaining)
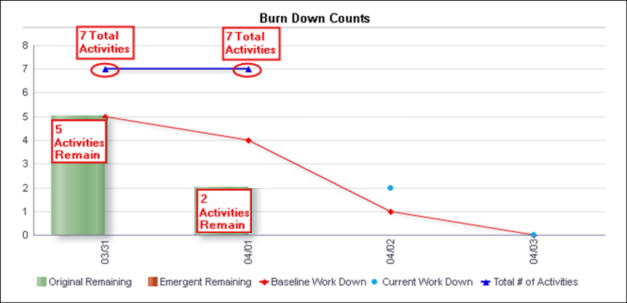
At the time the ETL process is run on 4/01/2013, there are two activities with hours remaining in the schedule. As all of the activities match the plan on 3/31/2013, there are seven Total Activities, which include activities with Remaining Units and all other activities included as of the sys_workdown_date ETL process snapshot.
The table shows a subset of the activity metrics that are summarized in the Burn Down Counts line-bar chart.