- sys_workdown_date: 3/31/2013
- Data Date: 4/02/2013
- ETL Process Date: 4/02/2013 11:59 p.m.
On Day 2, one activity is marked complete, one activity is started (but not completed as scheduled), and two new activities are added to the schedule to be completed on 4/03/2013. Three activities are left. The Data Date is updated accordingly and the actuals are captured from the schedule in the Burn Down.
Schedule Updates
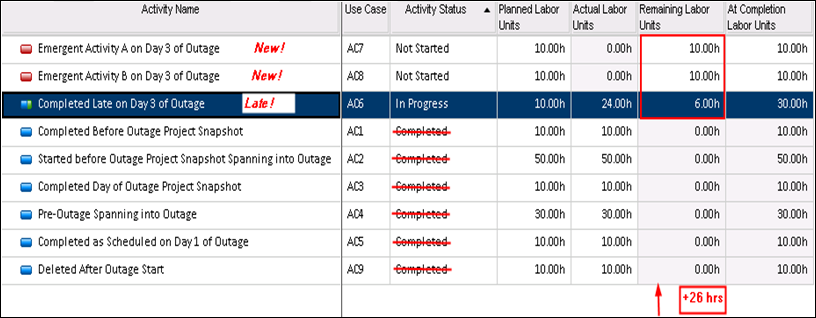
- Completed Late on Day 3 of Outage - AC6
- Status: In-progress
- Actual Units: 24 (24 today)
- Remaining Units: 6
- Planned: 10
- Emergent Activity A on Day 3 of Outage - AC7
- Status: Not Started
- Actual Units: 0
- Remaining Units: 0
- Emergent Activity B on Day 3 of Outage - AC8
- Status: Not Started
- Actual Units: 0
- Remaining Units: 10
- Deleted After Outage Start - AC9
- Status: Complete
- Actual Units: 10 (10 today)
- Remaining Units: 0
Burn Down Hours
Burn Down Hours Summary
- 0 baseline hours remain
- 6 actual hours remain (from original activities in the schedule)
- 20 emergent hours remain
- 170 Total hours (actual and remaining)
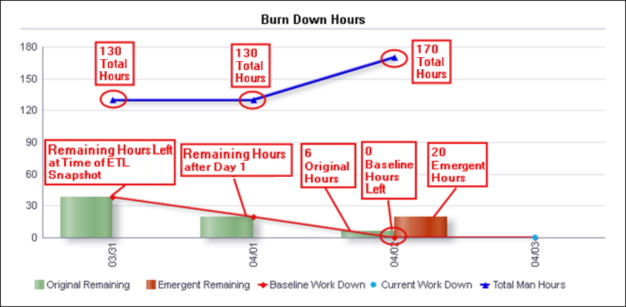
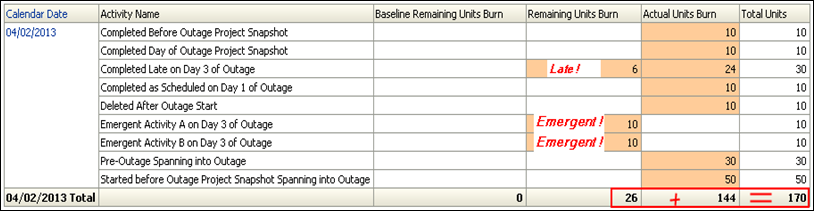
At the time the ETL process is run on 4/02/2013, there are six hours remaining from the late activity with additional units and 20 emergent hours remaining from the activities added to the schedule. There are 170 Total Hours, which is a combination of the Actual Units Burn and Remaining Units Burn. The Baseline Hours are 0, illustrating the deviation from the plan on 3/31.
The table shows a subset of the activity metrics that are summarized in the Burn Down Hours line-bar chart.
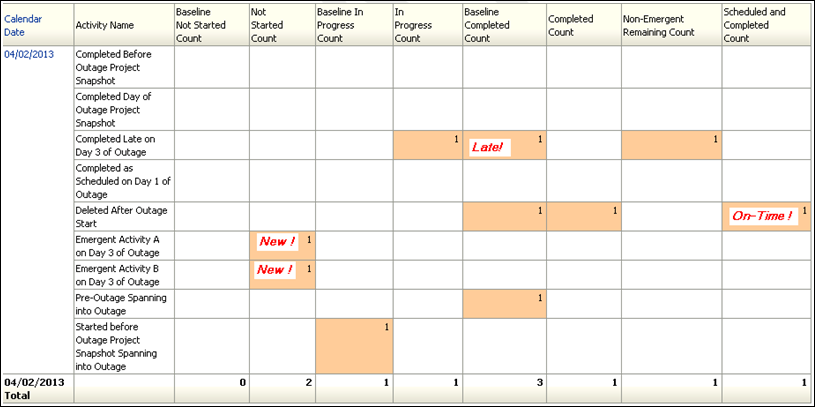
Burn Down Counts
Burn Down Counts Summary
- 1 Baseline Activity remains
- 1 Actual Activity remains (from original activities in the schedule)
- 2 Emergent Activities remain
- 9 Total Activities (Original and Emergent)
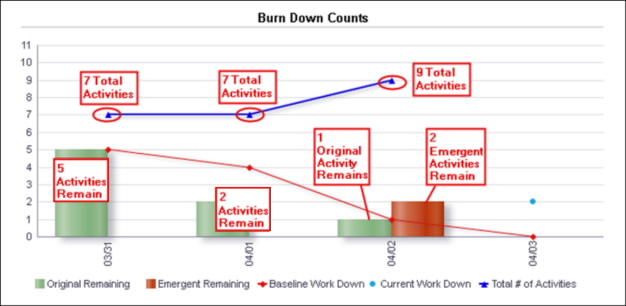
At the time the ETL process is run on 4/02/2013 there are two emergent, one original, and one baseline activity remaining in the schedule. There are nine Total Activities as a result of the two new activities added to the schedule.
The table shows a subset of the activity metrics that are summarized in the Burn Down Counts line-bar chart.