Purpose
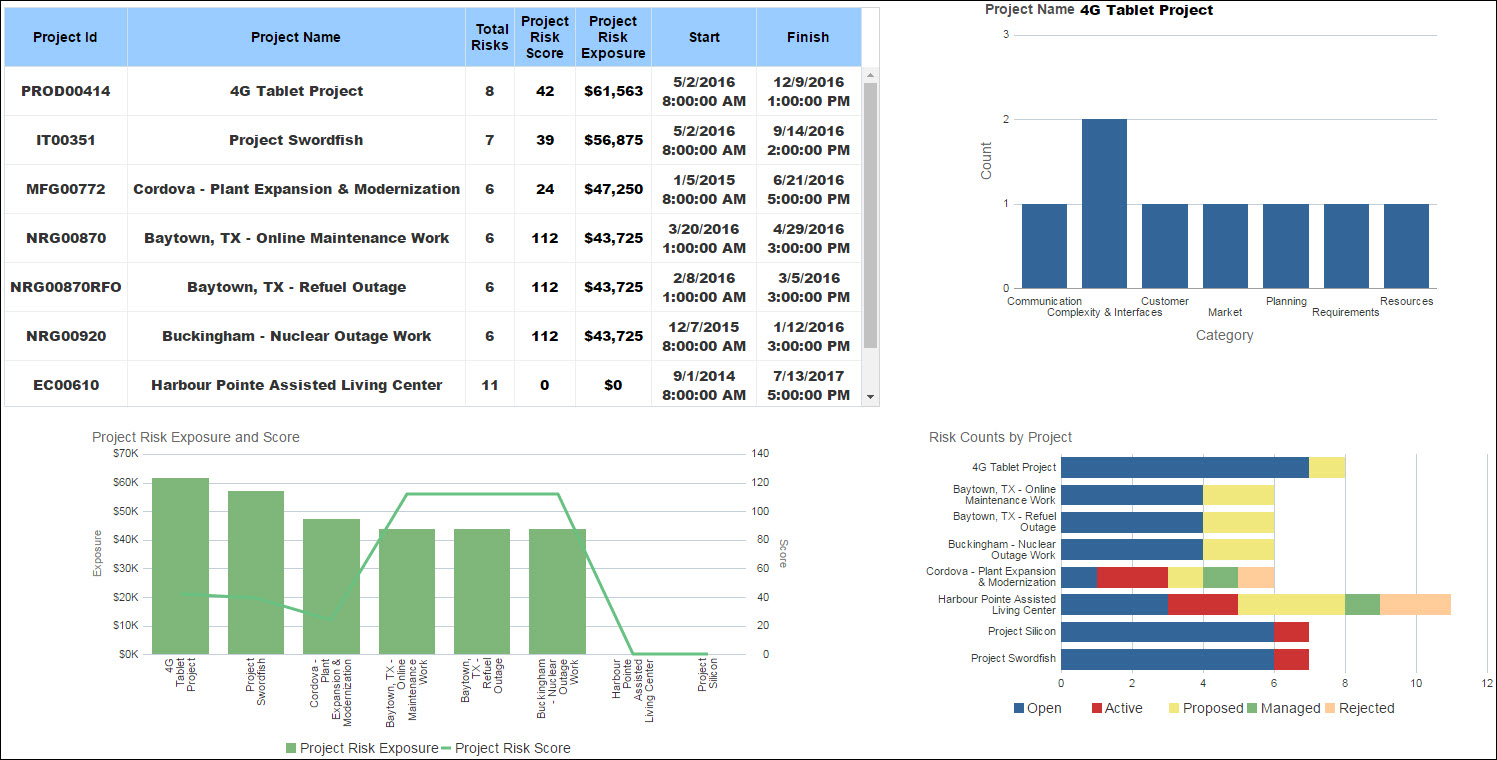
The table shows risk information by project. The table contains columns for:
- Project ID
- Project Name
- Total Risks
- Project Risk Score
- Project Risk Exposure
- Project Start Date
- Project Finish Date
The bar chart shows risk counts by project and uses master-detail linking to display the counts for a project based on the Project Name that is clicked on in the table. The counts are by Cost Category.
The stacked bar chart shows the risk counts by project. The bar color is based on the Risk Status.
The line-bar chart shows the Risk Score and Risk Exposure by project.
Location
- On the Home page, click Dashboards.
- Under Primavera, select Main.
- On Main dashboard, click the Risk page.
- On the Risk page, expand the Detailed Risk by Project section.
Subject Area
Activity