Purpose
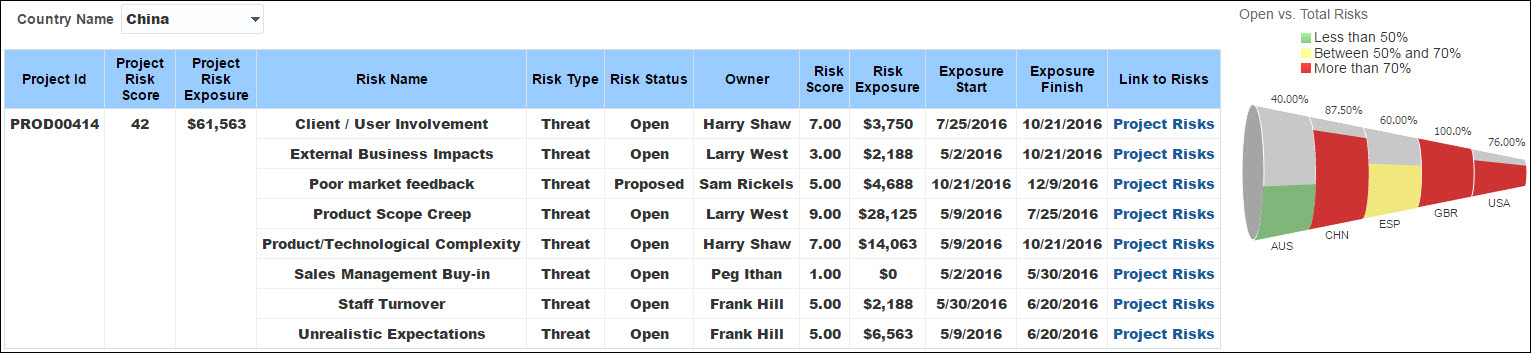
The pivot table shows detailed risk information for the country selected in the Country Name prompt, broken down by project ID. The pivot table contains columns for:
- Country Name
- Project ID
- Project Risk Score
- Project Risk Exposure
- Risk Name
- Risk Type
- Risk Status
- Project Owner
- Risk Score
- Risk Exposure
- Risk Exposure Start
- Risk Exposure Finish
- A link to the risks in P6 EPPM
The funnel chart shows open versus total risks by country code, with conditional formatting based on the percentage of risks that are open. Red denotes greater than 70% open risks, yellow between 50% and 70% and green less than 50% open risks.
Location
- On the Home page, click Dashboards.
- Under Primavera, select Main.
- On Main dashboard, click the Risk page.
- On the Risk page, expand the Detailed Risk by Location section.
Subject Area
Activity