Purpose
Investment by Strategic Objective
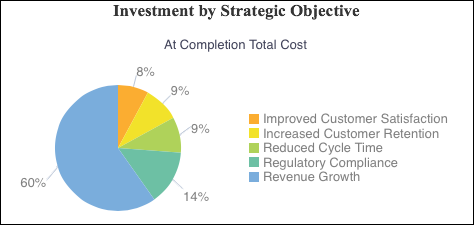
The pie chart shows the investment (determined from At Completion Total Cost for the project) broken down by the Strategic Objective project code. The segments represent the amount of At Completion Total Cost accountable to each Strategic Objective.
The Strategic Objective project codes are:
- Improved Customer Satisfaction
- Increased Customer Retention
- Reduced Cycle Time
- Regulatory Compliance
- Revenue Growth
Project Performance by Strategic Objective
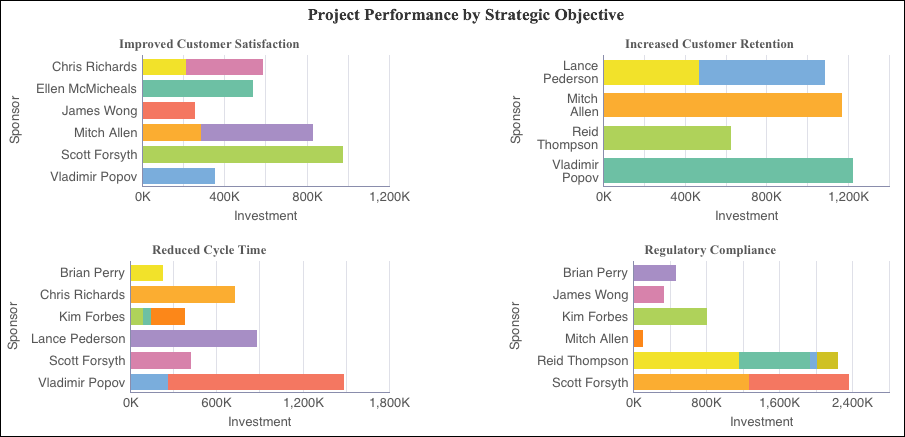
The Improved Customer Satisfaction, Increased Customer Retention, Reduced Cycle Time, Regulatory Compliance, and Revenue Growth stacked bar charts show the investment amount for projects grouped by sponsor name. Each chart shows data for a different set of projects, selected by a project code. Each band on a bar represents a different project.
The x-axis shows Investment. The y-axis shows Sponsor.
Objectives Drill
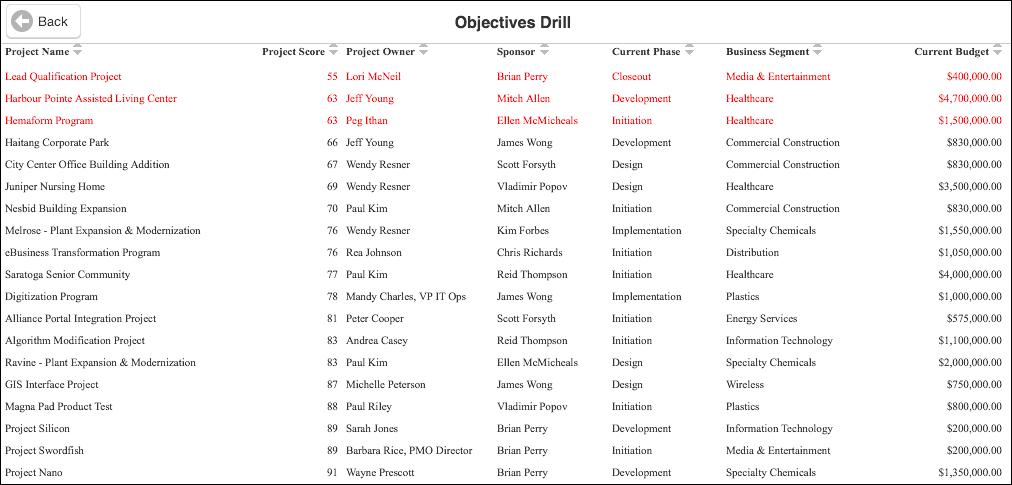
The table shows project details for the data point selected in either the Investment by Strategic Objective pie chart or Project Performance by Strategic Objective bar charts on the Portfolio: Objectives page. Poor performing projects (Project Score < 65) are highlighted in red.
The table contains columns for:
- Project Name
- Project Score
- Project Owner
- Sponsor
- Current Phase
- Business Segment
- Current Budget
Location
- From the My Apps page, tap Tablet Apps.
- Tap Executive Dashboard - Tablet (Light).
- Tap
 Table of Contents.
 - Tap Portfolio: Objectives.
Subject Area
Activity