Purpose
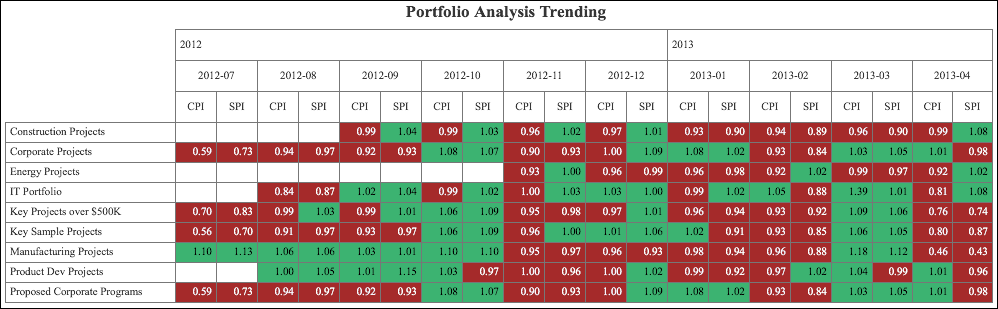
Portfolio Analysis Trending Pivot Table
The pivot table shows CPI and SPI per month for each portfolio. CPIs and SPIs lower than 1.00 are highlighted in red whereas CPIs and SPIs higher than or equal to 1.00 are highlighted in green.
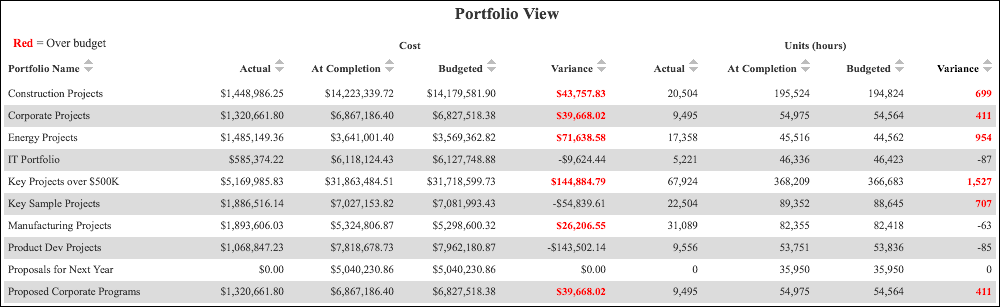
Portfolio View Pivot Table
The pivot table shows cost and units for each portfolio. Values that are over budget are highlighted in red.
The pivot table contains columns for:
- Portfolio Name
- Actual (Cost)
- At Completion (Cost)
- Budgeted (Cost)
- Variance (Cost)
- Actual (Units)
- At Completion (Units)
- Budgeted (Units)
- Variance (Units)
Location
- From the My Apps page, tap Tablet Apps.
- Tap Executive Dashboard - Tablet (Light).
- Tap
 Table of Contents.
 - Tap Portfolio: Performance.
Subject Area
Activity