Purpose
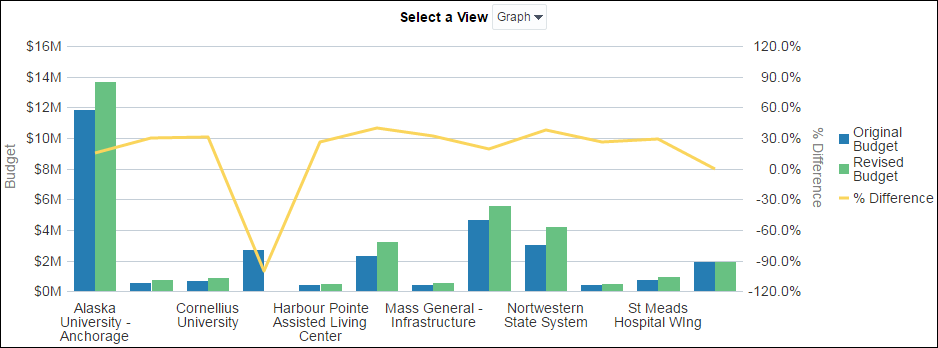
The line-bar chart shows bars for Original Budget and Revised Budget. The line represents the difference between Original Budget and Revised Budget shown as a percentage.
The x-axis shows projects. The y-axis for the bars (on the left) shows cost sheet values. The y-axis for the line (on the right) shows percentages.
The table contains columns for:
- Project Name (root-level)
- Original Budget
- Revised Budget
- % Difference (((Revised Budget - Original Budget) / Original Budget) * 100)
Location
- On the Home page, click Dashboards.
- Under Primavera, select Cost Sheet.
- On the Cost Sheet dashboard, click the Overview page.
- On the Overview page, expand the Original and Revised Budgets section.
Subject Area
Cost Sheet