Purpose
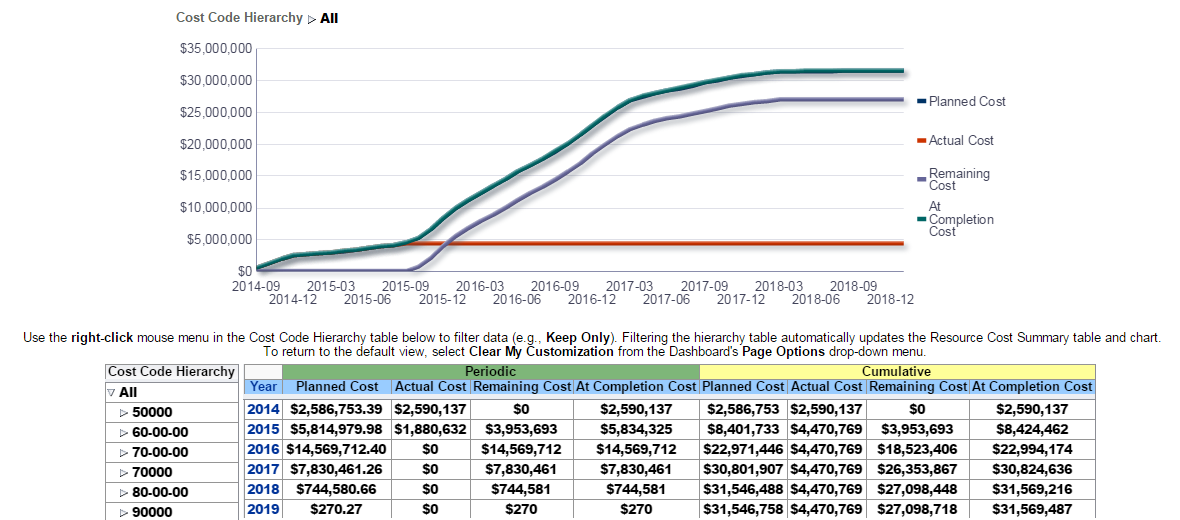
The chart shows the progression of Planned Cost, Actual Cost, Remaining Cost, and At Completion Cost. Date is represented on the x-axis, and amount is represented on the y-axis.
The table shows Periodic and Cumulative cost comparisons sorted by year. The table contains the following columns:
- Year
- Planned Cost
- Actual Cost
- Remaining Cost
- At Completion Cost
The data in this section can be filtered by Cost Code Hierarchy.
Location
- On the Home page, click Dashboards.
- Under Primavera, select Resource Analysis.
- On the Resource Analysis dashboard, click the Cost Summary page.
- On the Cost Summary page, expand the Cost Summary by CBS section.
Subject Area
Resource Cost Summary