Purpose
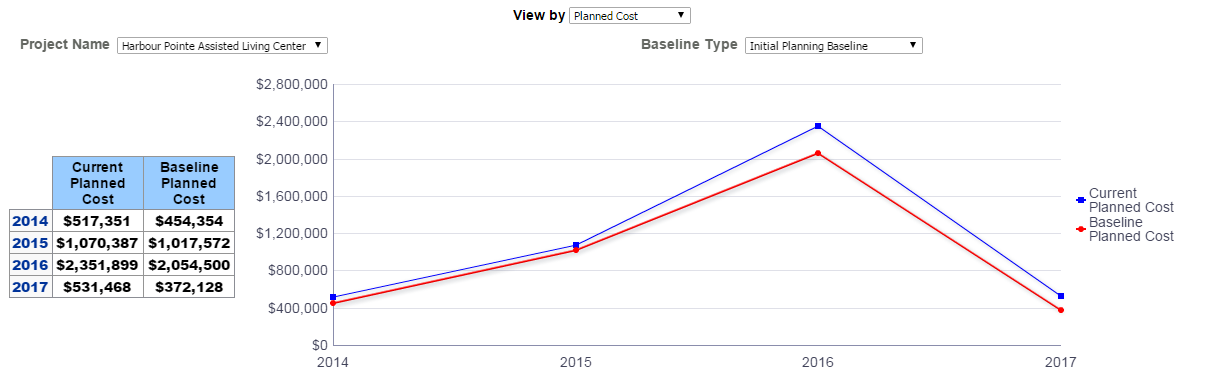
The chart shows the progression of Current Planned Cost and Baseline Planned Cost. Year is represented on the x-axis, and amount is represented on the y-axis.
The table shows Current Planned Cost and Baseline Planned Cost comparisons sorted by year.
Location
- On the Home page, click Dashboards.
- Under Primavera, select Resource Analysis.
- On the Resource Analysis dashboard, click the Cost Summary page.
- On the Cost Summary page, expand the Current vs. Baseline Cost section.
Subject Area
Resource Cost Summary