Purpose
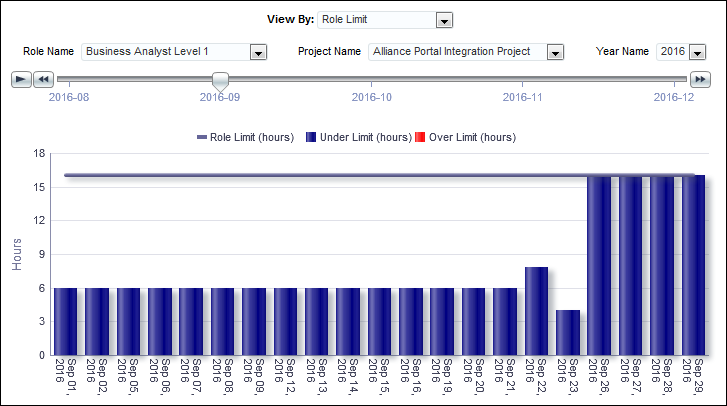
The bar chart shows role limit and primary resource limit details by day for the selected role and project. The x-axis shows the days of the selected month. The y-axis shows hours.
Location
- On the Home page, click Dashboards.
- Under Primavera, select Resource Analysis.
- On the Resource Analysis dashboard, click the Role Utilization page.
- On the Role Utilization page, expand the Role Over Limit section.
Subject Area
Role Utilization