Purpose
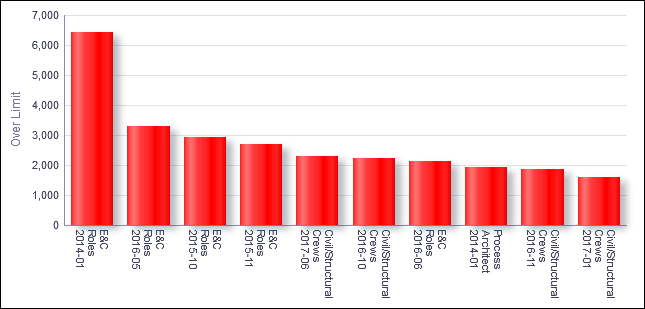
The bar chart shows the top ten roles over limit. The x-axis shows roles. The y-axis shows units.
Location
- On the Home page, click Dashboards.
- Under Primavera, select Resource Analysis.
- On the Resource Analysis dashboard, click the Role Utilization page.
- On the Role Utilization page, expand the Top 10 Roles Over Limit section.
Subject Area
Role Utilization