Purpose
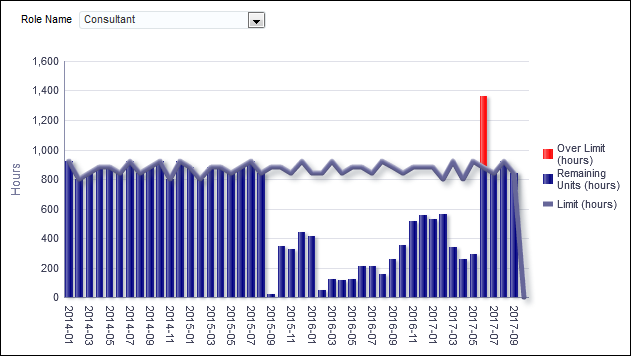
The bar chart shows role utilization by month for the selected role. The x-axis shows the month. The y-axis shows hours.
Location
- On the Home page, click Dashboards.
- Under Primavera, select Resource Analysis.
- On the Resource Analysis dashboard, click the Role Utilization page.
- On the Role Utilization page, expand the Role Utilization Over Time section.
Subject Area
Role Utilization