Purpose
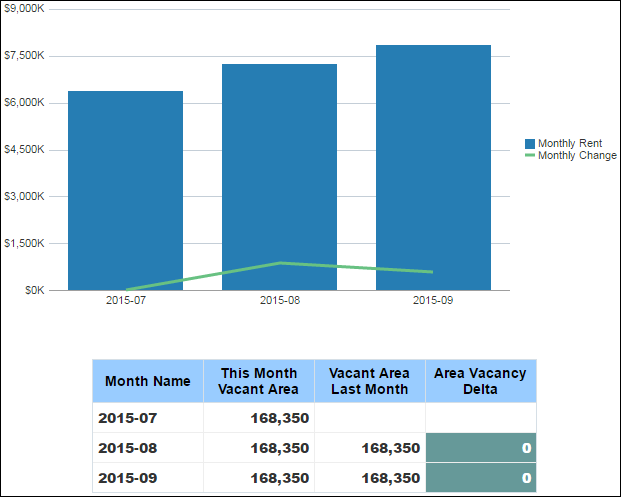
The line-bar chart displays rent history broken down by month name and monthly rent. The x-axis shows the year and month. The y-axis shows the cost of the monthly rent.
The pivot table shows area history details for the selected building. It includes columns for:
- Month Name
- This Month Vacant Area
- Vacant Area Last Month
- Area Vacancy Delta
Location
- On the Home page, click Dashboards.
- Under Primavera, select Facilities and Real Estate.
- On the Facilities and Real Estate dashboard, click the Space Management History page.
- On the Space Management History page, expand the Rent & Area History section.
Subject Area
Space Management History