Purpose
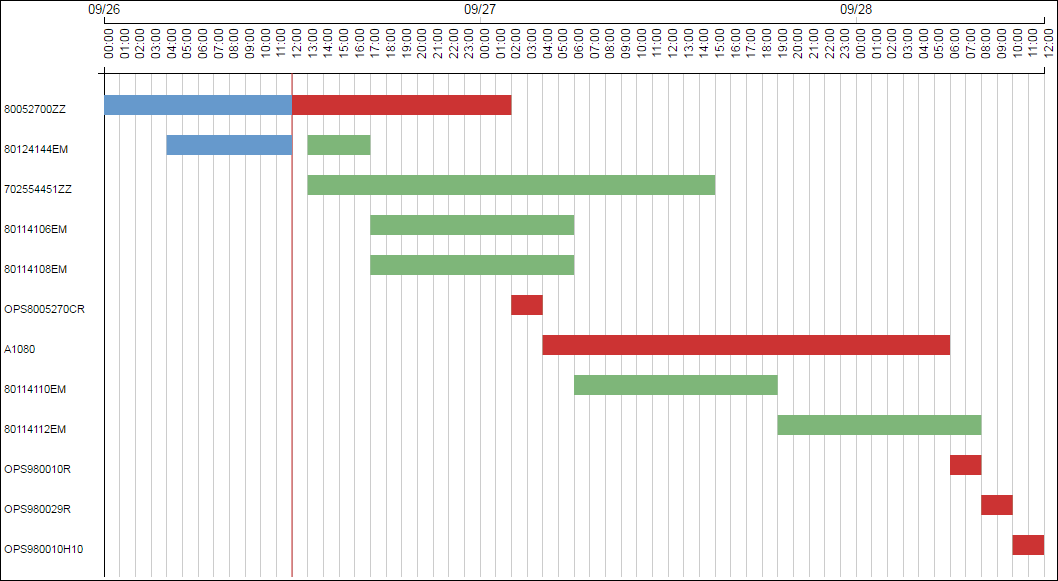
Use the Gantt chart to display and help determine the minimum amount of time needed for the completion of a project's activities. The x-axis shows the month, day, and time. The y-axis shows the specific operation within a project.
Location
- On the Home page, click Dashboards.
- Under Primavera, select More.
- On the More dashboard, click the d3 page.
- On the d3 page, expand the Gantt Chart - Critical Path Lookahead section.
Subject Area
Activity