Purpose
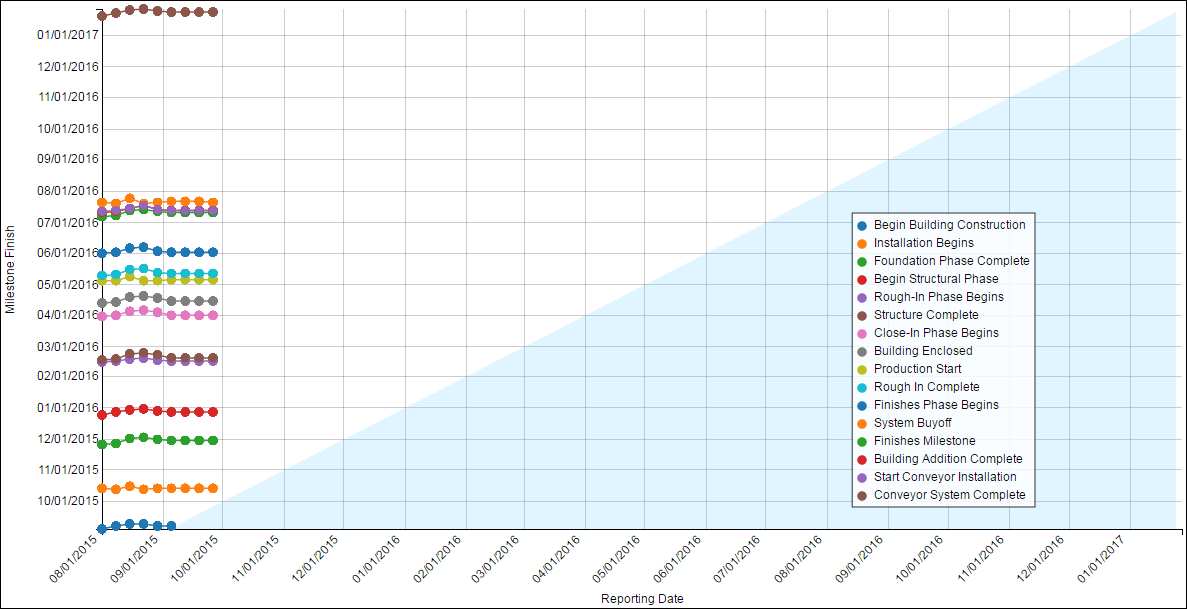
Use the trend analysis graph to help forecast milestone finish dates based on past data and analyses. The x-axis shows the reporting date. The y-axis shows the milestone finish date.
Location
- On the Home page, click Dashboards.
- Under Primavera, select More.
- On the More dashboard, click the d3 page.
- On the d3 page, expand the Milestone Trend Analysis section.
Subject Area
Activity