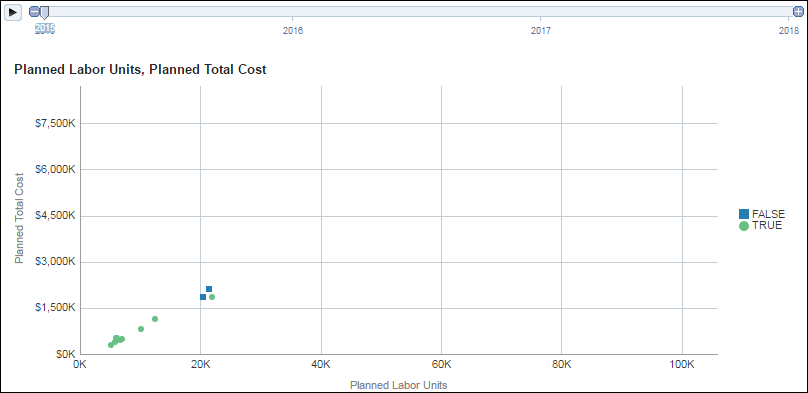
Purpose
Use the outlier scatter plot to identify and display outliers or exceptions within your data; the chart displays this as TRUE (is an outlier) or FALSE (is not an outlier) depending on whether the recorded data is determined to be an outlier . Click on any point in the plot to drill-down for more information.
Location
- On the Home page, click Dashboards.
- Under Primavera, select More.
- On the More dashboard, click the Advanced Analytics page.
- On the Advanced Analytics page, expand the Outlier section.
Subject Area
Activity