Purpose
This section shows:
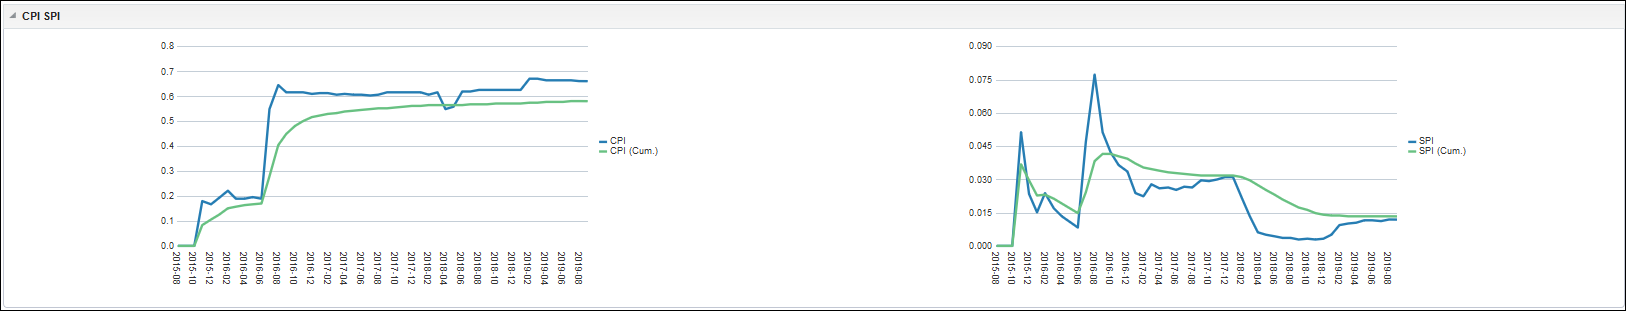
- A line chart which plots the CPI and Cumulative CPI by month.
- A line chart which plots the SPI and Cumulative SPI by month.
The x-axis shows the month and year. The y-axis shows the Cost Performance Index or the Schedule Performance Index.
Note: Cumulative SPI and Cumulative CPI are calculated from cumulative values, rather than being accumulations of CPI or SPI values from previous periods.
Location
- On the Home page, click Dashboards.
- Under Primavera, select Project Earned Value.
- On the Project Earned Value dashboard, click Unifier, and then click the CPI/SPI page.
- On the CPI/SPI page, expand the CPI/SPI section.
Subject Area
Activity