Purpose
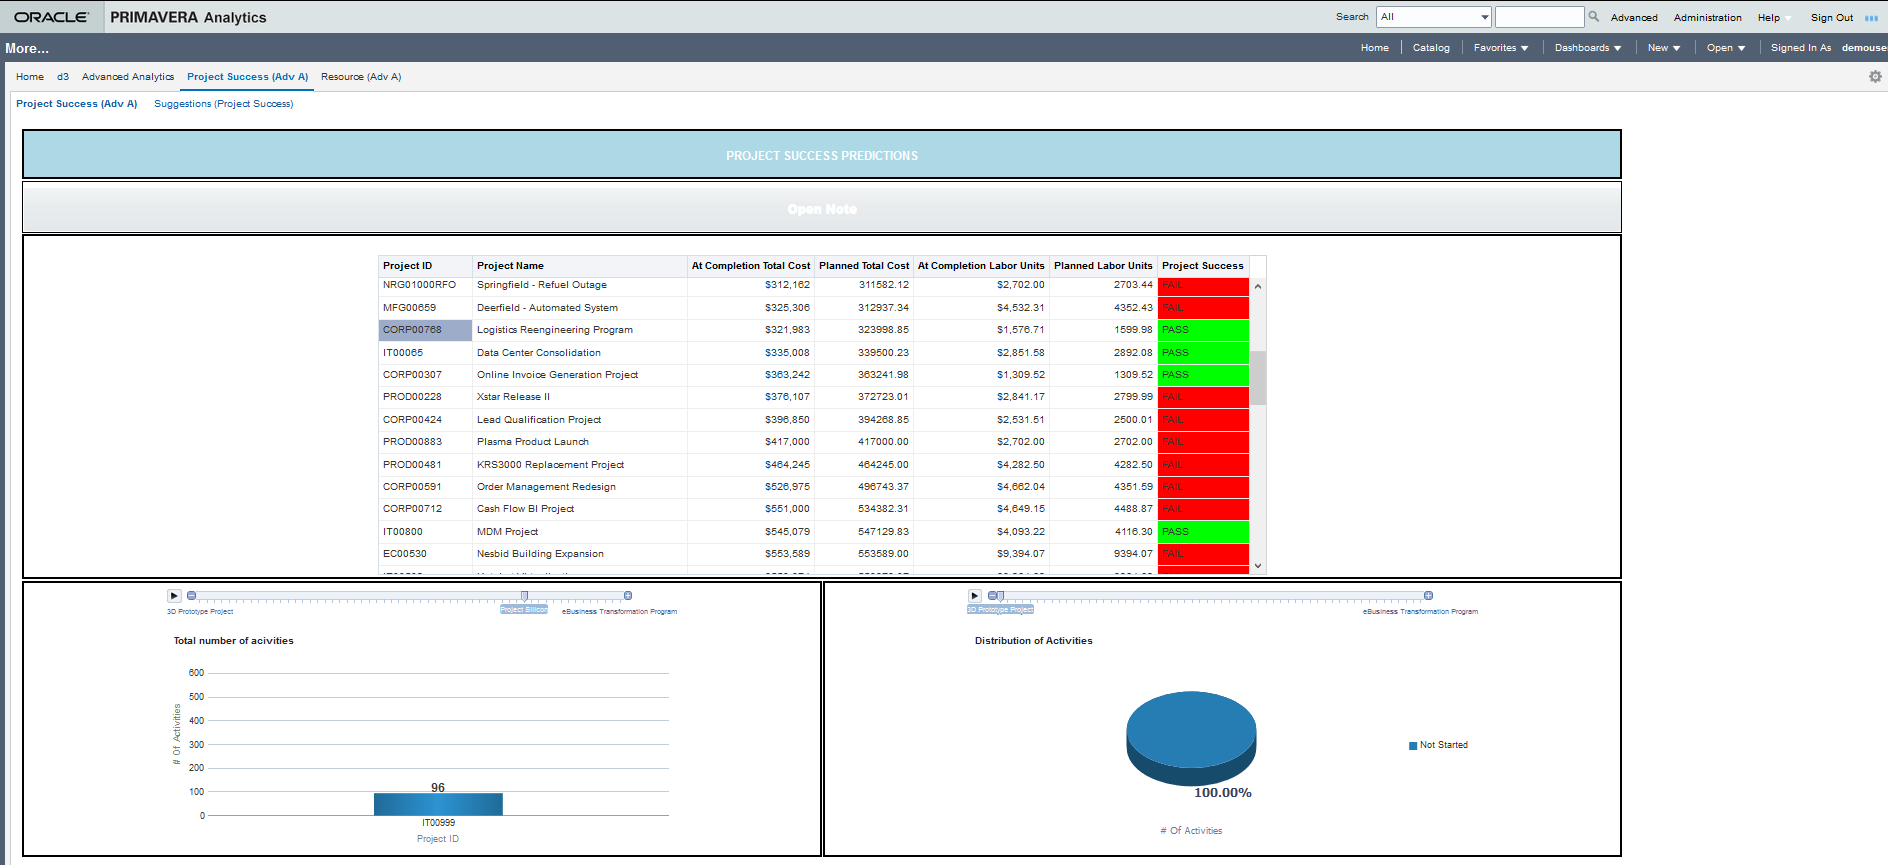
Use the Project Success analysis to predict the success or failure of new projects based on the characteristics of successful or failed projects using the assigned values for all completed projects. Click on a project name to see activities graph and the distribution of activities pie chart for the selected project.
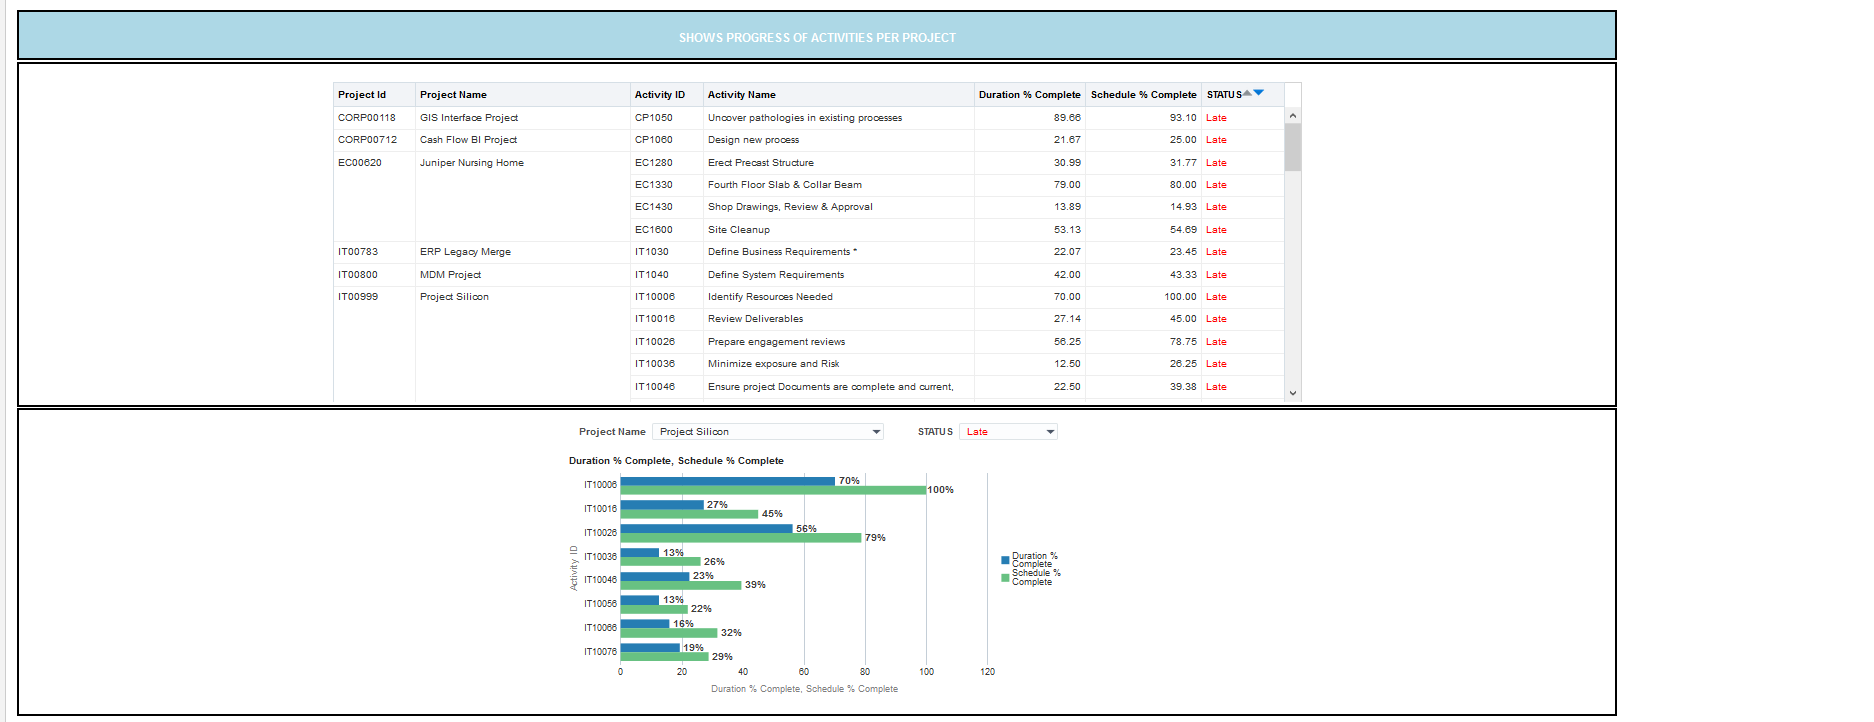
In the Show Progress of Activities per Project section, view a list of activities with the Duration % complete and Schedule % complete, and their current status.
- From the Project Name field, select a project.
- From the Status field, select a project status.
A bar chart for all the activities in a selected project is displayed. The x-axis displays the Duration % Complete and Schedule % Complete. The y-axis displays the Activity IDs associated with the selected project.
Successful Projects: A project is deemed successful if the following criteria are satisfied:
- The Completion Cost, Completion Units, Planned Cost, and Planned Units are not null, and
Completion Cost <= Planned Cost and
Completion Units <= Planned Units
- Completion Cost and Planned Cost are not null, and
Completion Units and Planned Units are null and
Completion Cost <= Planned Cost
- Completion Units and Planned Units are not null, and
Completion Cost and Planned Cost are null and
Completion Units <= Planned Units
Unsuccessful Projects: A project is deemed unsuccessful if:
- The Completion Cost, Completion Units, Planned Cost, and Planned Units are all null.
- All other cases fail by default.
Location
- On the Home page, click Dashboards.
- Under Primavera, select More....
- On the More dashboard, click the Project Success (Adv A) page.
Subject Area
Activity