Purpose
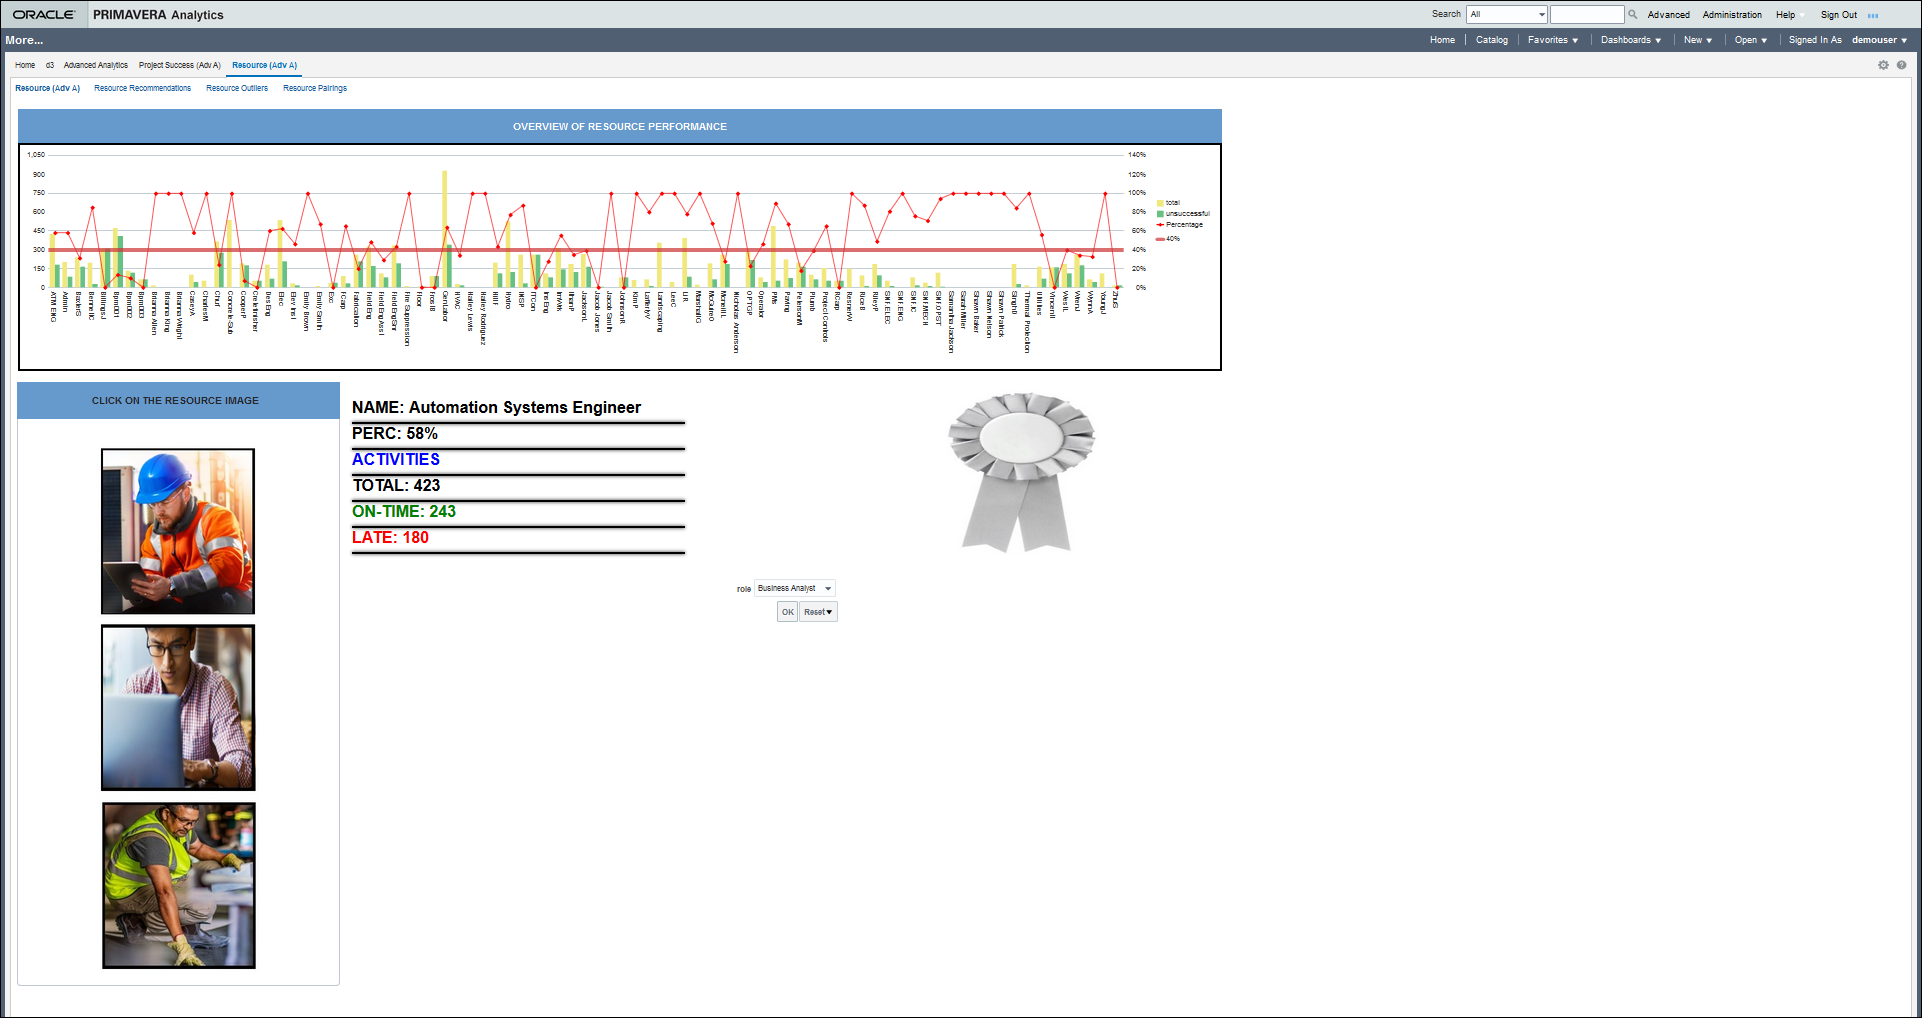
Use the Resource (Adv A) page to get a snapshot of the resource's performance based on past projects in a specific role. Click on an image to view the success rate of the resource from past history.
The Overview of Resource Performance bar graph displays the number to failed activities and total activities associated with each role. The line graph displays the success rate of the activities as a percent value. The x-axis displays the roles. The y-axis displays the activities on the right, and the success percent values on the left.
To view the performance of multiple resources in a specific role, select a role from the Role list and then click OK.
Location
- On the Home page, click the Dashboards menu.
- Under Primavera, click More....
- On the More dashboard, click the Resource (Adv A) page.
Subject Area
Resource