Purpose
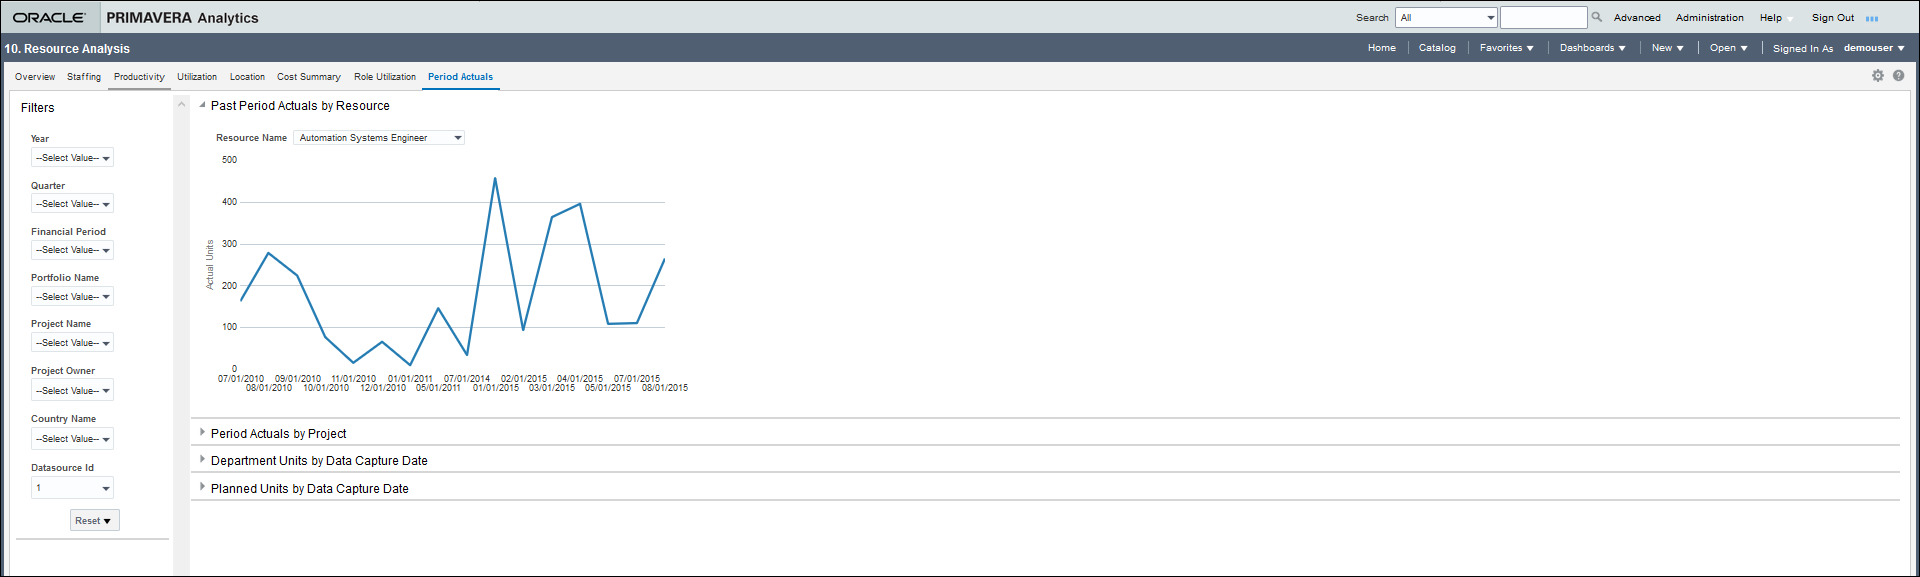
The line graph shows the actual units in past periods for each resource. The x-axis displays the past period data capture dates. The y-axis displays the actual units of the resource.
From the Resource Name list, select a resource to review their corresponding past period actuals chart.
Location
- On the Home page, click Dashboards.
- Under Primavera, select Resource Analysis.
- On the Resource Analysis dashboard, click the Period Actuals page.
- Expand the Past Period Actuals by Resource section.
Subject Area
Resource Period Actuals