8Forecasting (End User)
Forecasting (End User)
This chapter describes how users, both sales representatives and managers, create, adjust, and work with forecasts. It includes the following topics:
Scenario for Forecasting
This scenario gives one example of how Siebel Forecasting can be used. You can use forecasting differently, depending on your business model.
A sales representative at a large company is responsible for forecasting. The sales representative creates a periodic forecast by selecting a predefined forecast series. The application automatically creates the forecast by applying the forecast search rules, or a query to the account, opportunity, and partner-related revenue that is being managed. The sales representative analyzes the forecast data, viewing the anticipated revenues by product line and then by account. The sales representative then adds a revenue item and modifies an existing revenue item before submitting the forecast to their manager.
After the sales team members have submitted their forecasts, the sales manager runs the same forecast series, which aggregates the teams’ submissions. In this way, the sales organization can poll its members for their projected results for the period. The manager modifies the results of the forecast by adjusting one of the individual forecasts submitted. This change to a forecast does not carry over to any corresponding revenue records. To keep the data accurate, the sales manager updates the corresponding live revenue records with the changes made to the forecast.
The sales manager then remembers that the last time this same forecast was created, that changes were made to it as well. The sales manager selects auto-adjust to automatically apply the changes made in the most recent forecast to this forecast. This makes sure that any adjustments that were made in the last forecast (the most recent forecast date available) are automatically added to the current forecast. Finally, the sales manager analyzes the forecast using charts and reports, and when satisfied with it, submits the forecast to management.
Scenario for Forecasting - Product Quantity Forecasting
A regional sales manager runs a forecast report on a monthly basis. The sales manager needs to view the forecast results grouped by Accounts, by Product Line within the accounts, and by Products within product lines (three dimensions). The sales manager creates the forecast by selecting a predefined forecast series for which the aggregate levels for the three dimensions have been defined.
The sales manager has three direct reports and usually creates the forecast for their own use as well as for use by all direct reports, so that subordinates can focus their time and energy on managing the revenue pipeline and keeping opportunities up to date. The sales manager drills down into the forecast and uses the Forecast Summary view to easily find out the forecasted revenue and quantity of the products being forecasted and sold in each quarter of the year. After running the forecast, the sales manager analyzes all revenue records in the List and Tree view tabs.
The sales manager rejects or approves and adjusts the subordinates’ forecasts as appropriate. The sales manager makes appropriate adjustments for individual products, aggregated revenues for Product Lines, as well as total revenues for some Accounts. The sales manager notices that when changing the revenue or quantity values for a particular product, the adjusted value is automatically rolled up to its parent Product Line and in turn to its immediate parent Account. The same is true if the sales manager changes the revenue/quantity values for a Product Line or Account, that is, their respective aggregated values are rolled up to their immediate parent (for example, Account rolls up to Date). After making the adjustments the sales manager submits the forecast to management.
When the sales manager’s manager logs into the Siebel Sales application, all subordinates’ forecasts including the regional sales manager’s forecasts are visible in the forecast screen. The sales manager’s manager looks at the sales manager’s revenue adjustment and makes a note to call and discuss the changes with the sales manager over the telephone.
Setting a Default Unit of Measurement
All participants must define a default unit of measurement (UoM) in each category of UoM that they use in their forecasts.
To set a default unit of measurement
From the application-level menu, choose Tools, then User Preferences.
On the link bar, click Unit of Measurement.
Either create a new record and select the required category and unit of measurement, or change the unit of measurement in an existing record.
The fields are described in the following table:
Fields Description Category
The category of unit of measurement. Select Length, Volume, or Weight.
Unit of Measurement
The preferred unit of measurement for the user (manager or sales representative).
Creating a Forecast
A forecast is a snapshot of revenues over time. The following procedure explains how to create a forecast.
To create a forecast
Navigate to the Forecasts screen.
In the Forecasts list, add a new record and click the Forecast Series select button.
In the Pick Forecast Series dialog box, select the forecast series you are basing this forecast on, and then click OK.
Click the Forecast Date select button.
In the Pick Forecast Series Date dialog box, select the forecast date you want to apply to this forecast, and then click OK.
Step off the forecast or save the record to generate the forecast.
The forecast record’s revenue fields (revenue, cost, margin, and expected revenue) are calculated. Some fields are described in the following table.
Field Name Description Forecast Date
Indicates the start range of the forecast.
Forecast Series
Indicates the forecast series this forecast is based on.
Created By
Read-only. Indicates the name of the person who created the forecast. In some cases the owner of a forecast is not the creator of the forecast.
Submitted By
Read-only. Indicates the name of the person who submitted the forecast.
Owner
Indicates the person who owns or is responsible for this forecast.
Position
Read-only. Indicates the position of the owner of this forecast.
Organization
Read-only. Indicates what organization the owner of this forecast belongs to.
Forecast Revenue
Read-only. The sum of the revenues included in this forecast, that is, the total forecast revenue.
Total Adjustment By Subordinate
Read-only. The sum of all revenue adjustments made by all subordinates in this forecast for this manager.
Best Case
Read-only. A best case estimate of what revenue will be produced by an opportunity.
Expected Revenue
Expected Revenue = Win Probability * Revenue / 100.
Updated
Read-only. Indicates the date and time the forecast was last changed.
Status
Choose from Pending, Active, and Submitted.
Worst Case
Read-only. A worst case estimate of what revenue will be produced by an opportunity.
Cost
Read-only. Expense associated with an opportunity.
Margin
Read-only. A calculated field that displays the revenue figure minus the cost.
Drill down on the forecast record to view revenue details.
Drill down on each revenue item to view further information.
Adding Forecast Details
Occasionally, the forecast that is created does not include each of the revenue items that it needs to include. Additional revenue records can be added manually.
The list of records that can be added is determined by the Associate Search Spec of the forecast series, see Creating Search Specifications for Forecast Series.
To add forecast details
Navigate to the Forecasts screen.
In the Forecasts list, drill down on the forecast to which details will be added.
In the Details view, add a new record.
In the Add Revenue Items dialog box, select the appropriate revenue item and click OK.
Note: Users can add many revenue items at the same time by holding down CTRL or SHIFT and selecting the appropriate items. Users can also run a query and select each of the returned records.
Adding Ad-Hoc Revenue Line Items to a Forecast
Managers and sales representatives who are responsible for sales forecasts that span wide horizons in terms of, for example, larger territories or product lines, can add an ad-hoc revenue line item to a forecast. The ad-hoc revenue linen item is reflected in both the pipeline revenue and the forecast rollup, and can be assigned to any of the subordinates in the forecast.
Manager ability to add an ad-hoc revenue line item to a forecast helps to achieve more accurate forecasts and improve quota attainment.
To add an ad-hoc revenue line item to a forecast
Navigate to the Forecasts screen.
In the Forecasts list, either drill down on the forecast to which you want to add an ad-hoc revenue line item, or create a new forecast.
For more information about creating a forecast, see Creating a Forecast.
In the forecast Details view, click New to add a new ad-hoc revenue line item, and complete the necessary fields.
Some fields are described in the following table.
Note: When adding an ad-hoc revenue line item to a forecast, it is not necessary to associate it with a Product, Product Line, or Opportunity.Field Name Description Product
Use the selection dialog box to associate this new ad-hoc revenue line item with a product, if required.
Product Line
Use the selection dialog box to associate this new ad-hoc revenue line item with a product line, if required.
Quantity
Enter the amount of product or service being purchased.
Price
Enter the unit price of the product or service being purchased.
Revenue
Enter the total revenue this new ad-hoc revenue line item will produce.
Opportunity
Specifying an opportunity is optional when adding a new ad-hoc revenue line item to a forecast. Sales representatives and sales managers have opportunity revenue records.
Viewing Forecasts
By default, according to the position hierarchy, all participants in a forecast series report their forecasts to their manager. However, if a forecast-specific hierarchy is defined for a forecast series of type My Revenues - Indirect Sales, then users can roll up and submit forecasts to managers that are outside their reporting hierarchy.
The Forecast List screen displays a list of all forecasts where the user is a participant or the user has a subordinate. When viewing the list of forecasts, it is possible to filter on a number of options. To view the list of forecasts, complete the steps in the following procedure.
To view a list of forecasts
Navigate to the Forecasts, then Forecast List screen.
Select an option from the My Forecasts drop-down list.
The following table describes the options that are available.
All Forecasts drop-down list Option My Forecasts
Select to display a list of your forecasts.
My Direct Team’s Forecasts
Select to display a list of forecasts belonging to your direct reports.
All Forecasts
Select to display a list of all forecasts, including those belonging to you and your direct reports.
My Indirect Forecasts
Select to access a list of forecasts of type My Revenues - Indirect Sales, which may have been generated outside of your reporting hierarchy.
When you first select this option, the forecast list does not display. You must select a forecast series from the Select a Forecast Series drop-down list, then click Go to display the list of forecasts.
Note: Forecasts of type My Revenues - Indirect Sales are listed only in the My Indirect Forecasts list view. They are not included in the My Forecasts, My Direct Team’s Forecasts, All Forecasts, or All Forecasts Across Organizations list views.All Forecasts Across Organizations
Select to display a complete list of forecasts across all organizations.
Viewing Forecast Details
The Forecast Details view contains the elements that sum to the total forecast revenue. At the sales representative level, the details include each of the revenue items queried into the forecast. The manager’s forecast details can include summary amounts for immediate subordinates, if it is a summary type forecast, and direct revenue from the manager’s own deals. The manager’s forecast can include subordinates’ forecast details, for a detail type forecast, instead of summaries depending on how the forecast series is set up.
Details can be adjusted. To view the adjustment history, click the Date hyperlink. Also, from the Menu button users can unadjust, update from revenue, update to revenue, auto-adjust an item from the last forecast, and see net revenue change from the last forecast.
The Link Type field in the Details view indicates the type of records. The possible values are:
Direct Summary. A summary record of a direct subordinate forecast.
Item. A record owned by a subordinate.
Own Item. A revenue record owned by the current forecast. Users can adjust their own item records, which allows for changing expectations for the forecast without changing the actual revenue record.
Own Summary. A summary record for the current user. These records represent the detail records grouped only by date. The totals are the sums of all the detail records.
Three options are available for viewing the details of a forecast: List, Spreadsheet, and Chart. To view the details of a particular forecast, complete the steps in the following procedure.
To view forecast details
Navigate to the Forecasts screen.
In the Forecasts list, drill down on the forecast for which you want to view the details.
In the Details view, drill down on each revenue item to view more information or click the List, Spreadsheet, or Chart hyperlink to view all details. The information is displayed based on your selection.
Viewing the Forecast Summary
The Forecast Summary view displays the total forecast revenue broken down into the periods specified by the forecast series and grouped according to the aggregate levels defined for the forecast series. For example, the aggregated revenue, price, and quantity information can be grouped according to Account by Product Line by Product.
The summary periods are indicated by their respective start dates. For example, the calendar month of November 2004 is displayed as Nov 04 in the Summary view. The Revenue field shows the sum of revenues for each summary period. The owner can modify these summary revenue values. Changes to the summary revenue values immediately update the total forecast revenue.
The fields in the Summary view are displayed from first to last according to the aggregation level defined by the administrator. The Date field is considered to be at level 0 and is always the first column. The next field is the level 1 field, then the level 2 field and so on. For more information about how the administrator defines the aggregation levels, see Adding Aggregation Levels.
Every cell in the Summary view is editable, however new records can only be added in the Detail view.
Three options are available for viewing the forecast summary: List, Tree, and Chart.
Viewing a Subordinate’s Forecasts
From the Subordinates view, users can add or delete forecast participants who report to them, and they can drill into a subordinate’s forecasts by using the Owner hyperlink. For summary forecasts, managers can make broad percentage adjustments. For more information, see Adjusting a Subordinate’s Forecast.
Viewing and Creating Subordinate’s Forecasts Remotely
Managers can create a forecast and see their subordinates’ forecasts remotely only if the forecasts of the subordinates have already been created and synchronized to the manager’s local database.
A manager cannot create a subordinate’s forecast using auto-forecast on the Siebel Remote Web Client as the manager can when using the connected client. Therefore, there can be no duplication of effort between the manager and the subordinate, and synchronization confusion is avoided.
If a sales representative’s forecast has not already been created, then the manager, after creating the representative’s forecast remotely and then docking, needs to associate the subordinate’s forecast using the Subordinates view in the Forecasts screen.
About Forecast Adjustments
Managers can adjust subordinate forecasts in one of the following three ways:
At the detail level from the Forecasts, then Details view for a detail type forecast
By summary period from the Forecasts, then Summary view for a summary type forecast
By subordinate for percentage adjustments for summary type forecasts
When a sales representative clicks Rollup for a specific forecast while in the forecast’s Details view, the forecast is summed into the corresponding periodic summary records, which is displayed from the Summary tab. When summary records are updated, the total displayed in the Forecast Revenue field is also updated. When a sales representative clicks Rollup, any prior adjustments to the summary records are overwritten with the new values brought in from the detail records. For more information about forecast adjustments, see the following:
Adjusting a Detail Depth Forecast
In a detail depth forecast, each revenue line item in the Details view is rolled up through the hierarchy. As a result, senior management has access to every forecast detail revenue item for the review. In this scenario, users need to make sure that every adjustment is made in the Details view. After adjusting the details, users must click Rollup to recalculate the modified forecast. To see forecast details by periodic summary, users can view the forecast from the Summary tab.
If the detail depth is Revenue detail, a manager can edit the Adjustment field for subordinates only in the Forecast Detail view. In the manager's Forecast Summary view, the Adjustment field for subordinates is read-only as shown in the following table.
Adjustment Column in View |
||
|---|---|---|
Forecast Series Detail Depth |
Summary View |
Detail View |
Summary Only |
Editable |
Read-only |
Revenue Detail |
Read-only |
Editable |
Standard |
Editable |
Read-only |
Once a manager adjusts a subordinate’s detail record, the Siebel application maintains an adjustment history. Superior management levels can view the adjustment history, however, the subordinate, whose forecast record was adjusted cannot view the adjustment.
To adjust a detail depth forecast
Navigate to the Forecasts screen.
In the Forecasts list, drill down on the forecast you want to adjust.
In the Details view:
Select the revenue line item detail you want to adjust, and change the adjustment, revenue, quantity, price, or other value as appropriate. Repeat for each line item you want to adjust.
Click New to add a new ad-hoc revenue line item.
For more information about adding an ad-hoc revenue line item, see Adding Ad-Hoc Revenue Line Items to a Forecast.
Click the menu button, and then click Rollup Forecast to recalculate the forecast.
The adjusted forecast amount is posted by period to the summary list in the Summary view.
(Optional) Click the Summary tab to view the summary list by period.
Note: Any adjustments to the summary records are not rolled up in a detail depth forecast. Managers can view the summary record adjustments by drilling into their subordinates’ forecasts.
Adjusting a Summary Depth Forecast
In a summary depth forecast, each record in the Summary view is rolled up to your direct manager. As a result, a manager can see the detailed line item records (that belong to the manager) and the summary records of direct subordinates from the forecast Details view. Users can adjust detail records and click Rollup to calculate the modified forecast. They can then further adjust those records from the Summary view.
A manager can make an additional adjustment to a subordinate’s forecast from the Subordinates view in the Forecasts screen. In this view, a manager can see the total forecast revenue amount for direct subordinates. A manager can also make a broad percentage adjustment. This percentage adjustment is calculated into the rollup for each subordinate when the Rollup button is clicked. For more information, see Adjusting a Subordinate’s Forecast.
If the detail depth is Summary Only, a manager can edit the Adjustment field for subordinates only in the Forecast Summary view. In the manager's Forecast Detail view, the Adjustment field for subordinates is read-only as shown in the following.
To adjust a summary depth forecast
Navigate to the Forecasts screen.
In the Forecasts list, drill down on the forecast you want to adjust.
Click the Summary tab and then select the summary record you want to adjust.
Adjust the revenue, best case, worst case, or other value you want to modify.
Repeat step 3 through step 4 for each line item you want to adjust.
Adjustments to summary records immediately update the totals for the Forecast record.
Adjusting a Standard Depth Forecast
In a standard depth forecast, each revenue line item in the Details view is rolled up through the reporting hierarchy. As a result, a manager can see the detailed line item records of subordinates and of the manager from the forecast Details view. Users can only make adjustments in the Summary view, but can review the revenue details of subordinates in the Details view.
If the detail depth is Standard, a manager can edit the Adjustment field for subordinates only in the Forecast Summary view. In the manager's Forecast Detail view, the subordinate Adjustment field is read-only as shown in the following image.
To adjust a standard depth forecast
Navigate to the Forecasts screen.
In the Forecasts list, drill down on the forecast you want to adjust.
Click the Summary tab and then select the summary record you want to adjust.
Change the Adjustment field as required.
Repeat step 3 through step 4 for each line item you want to adjust.
Adjustments to summary records immediately update the totals for the Forecast record.
Auto-Adjusting a Forecast
Auto-adjust applies to forecasts with details only. Use auto-adjust to apply any changes made in the most recent forecast to the current forecast. Once auto-adjust is selected, any adjustments that were made in the last forecast (the most recent forecast date available) are automatically added to the current forecast. Any fields that have changed, such as, Probability, Qty (quantity), Revenue, Expected Revenue, Price, Commit, Close Date, Best Case, Worst Case, Margin, and Cost are updated in the current record.
To auto-adjust a forecast
Navigate to the Forecasts screen.
In the Forecasts list, drill down on the forecast to be updated.
In the Details view, select the revenue line item or items you want to apply adjustments to.
Click the menu button, and then click Auto-Adjust Selected Details.
Note: Auto-adjust is only visible as an option if there is a past forecast to be compared to.
Unadjusting a Forecast
After using auto-adjust or making an adjustment to another user’s record, you can use unadjust. Unadjusting a forecast only applies to forecasts with details.
To unadjust a forecast
Navigate to the Forecasts screen.
In the Forecasts list, drill down on the forecast to be updated.
In the Details view, select the record or records you want to unadjust.
Click the menu button, and then click Un-Adjust Selected Details.
Adjusting a Subordinate’s Forecast
When the sales manager creates a forecast, the Subordinates view is populated with the total value of each of the manager’s subordinates’ forecasts.
This view offers the manager the ability to adjust the aggregate value of each subordinate’s forecasts by a percentage based on the individual’s historical forecasting accuracy. The percentage adjustment is entered manually into the Adjust % field. The Revenue field is factored by this percentage and the result is displayed in the Adjusted Revenue field.
A manager cannot edit any of the other fields in the Subordinates view and this also applies to new fields added to the view. If a manager needs to adjust revenue or other details for subordinates, the manager must do so in the Details view.
To see the details of a subordinate’s forecast, drill down on the Owner hyperlink.
To adjust a subordinate’s forecast
Navigate to the Forecasts screen.
In the Forecasts list, drill down on the summary forecast that includes subordinate forecasts.
Click the Subordinates tab.
Locate the record that requires adjustment, select the Adjust % field and then enter the appropriate percentage in whole numbers.
The Adjusted Revenue field displays the value of the revenue field factored by the percentage adjusted. (The Adjusted Revenue field is a calculated field. No data entry is allowed.)
API Driven Forecasting
You can generate forecasts through batch mode using the Forecast 2000 - Forecast Service, which is provided by default with your Siebel business application.
To generate forecasts through batch mode, you must implement the functionality that is available with the Forecast 2000 - Forecast Service and decide, for example, when and how often to run the batch mode forecasting job.
For more information about API driven forecasting, see API Driven Forecasting which describes the functionality available with the Forecast 2000 - Forecast Service.
Submitting a Forecast
The last step in creating a forecast is for the user to submit it to the manager for review.
To submit a forecast
Navigate to the Forecasts screen.
In the Forecasts list, drill down on the forecast to be submitted.
In the forecast form click the Submit button.
After submitting the forecast, the Status changes from Active to Submitted. A user who submits a forecast to their manager cannot change the status, as all the fields becomes read-only fields.
Note: A Siebel administrator or sales manager can change the status of a submitted forecast to enable the user or sales representative to revise a forecast and submit it again.
Rolling Up a Forecast
When users click Rollup in the Forecasts screen, the forecast detail item records in the Details view (that match the Rollup search spec) are summed up in the Summary view. As the summary records are updated by the forecast details, the total forecasted revenue is also updated. Changes made to the detail records, such as revenue or quantity adjustments are then part of the summary record totals and the total forecasted revenue. Additionally, when Rollup is selected, any adjustments made earlier to summary records are lost when new values are brought in from the detail records. For information about setting the Rollup search spec, see Creating a Forecast Series.
Refreshing a Forecast
Managers’ forecasts can contain subordinates’ forecasts that are not up-to-date, because subordinates can add revenue records to their forecasts after the manager creates the forecast.
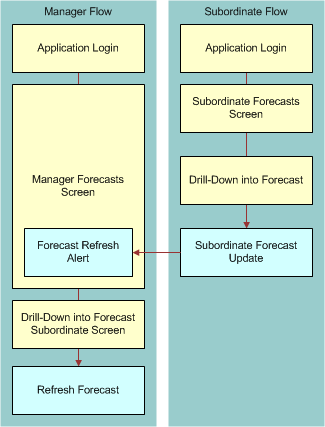
However, a manager can see which forecast contains subordinate’s updated forecasts by means of the Refresh Alert column in the Forecast List view. (A Refresh Alert flag is set for the forecast containing the subordinate’s updated forecasts.) The manager can drill down on such a forecast and navigate to the Subordinate view. In the Subordinate view, the Forecast Updated field contains a check mark for each subordinate forecast that is updated. The manager can then click the Refresh button in the Subordinate view to update the forecast. The Forecast Updated field is then unchecked and the Refresh Alert flag is reset indicating that the refresh of the forecast is completed. The entire forecast is not re-created; it is only updated with the changed revenue records.
A subordinate logs into the application, navigates to the Subordinate forecasts view, drills down into a forecast, and updates the forecast.
When the subordinate is finished updating the forecast, the subordinate’s manager receives a forecast Refresh Alert.
The subordinate’s manager drills down into Subordinate forecasts view, and refreshes the forecast.
The refresh functionality is applicable only to the first level subordinate in the hierarchy. Therefore, a manager can refresh forecasts belonging to direct subordinates but not the subordinate’s subordinate forecasts. When a manager refreshes the forecast, the manager’s manager sees that the forecast is updated and that manager must refresh the forecast in turn.
If the manager has made any adjustment to the subordinate’s revenue forecast, the adjusted values are not preserved after the refresh. The manager must then re-evaluate the newly-created records and adjust accordingly.
The refresh function works differently depending on whether the updated forecast is a Revenue Details or Summary Only type of forecast.
In a Summary Only forecast, the new revenue records are automatically pulled into the manager’s Details view even before the manager clicks the Refresh button. However, the manager’s forecast does not actually reflect the changes until the manager clicks the Rollup button to align the Summary and Details views. Siebel Forecasting rolls up from the Summary view, or subordinate, and the changes in the Details views are discarded if not aligned with the Summary. Clicking the Refresh button:
Performs a rollup operation to align the Summary and Details views
Resets the flag for the Refresh Alert column
In a Revenue Details forecast, the new revenue records are not automatically pulled into the manager’s forecast. First, the alert flag is set so that the manager is aware of the subordinate’s forecast revenue changes. So clicking the Refresh button:
Pulls in the data from the subordinate’s forecast into the manager’s forecast
Performs a rollup operation to align the Summary and Details views
Resets the flag for the Refresh Alert Column
-
Note: The refresh functionality does not work if a user deletes a forecast record and then recreates it. This generates a new row ID for the record and therefore breaks the association with the manager's forecast. The manager can then no longer see the subordinate’s record, making a refresh impossible.
Refreshing a Forecast
A manager uses the following procedure when the manager notices that one of the forecasts contains subordinate’s updated forecasts as indicated in the Refresh Alert column in the Forecast List view.
To refresh a forecast
In the Forecasts list, drill down on a forecast that contains a red flag in the Refresh Alert column.
Navigate to the Subordinates view.
The Forecast Updated field contains a checkmark for each subordinate forecast that is updated.
Select the subordinate forecasts that have been updated.
Click the Refresh button.
Rejecting a Subordinate’s Forecast
A manager can select any subordinate’s forecast and reject the forecast by clicking the Reject button. After the forecast is rejected for a subordinate, the subordinate can update the forecast and re-submit it.
To see the details of a subordinate’s forecast, drill down on the Owner hyperlink.
To reject a subordinate’s forecast
Log in as Manager.
Navigate to the Forecasts screen.
In the Forecasts list, drill down on the forecast that includes subordinate forecasts.
Click the Subordinates tab.
Locate the record that requires rejecting and click the Reject button.
Updating a Rejected Forecast
The following procedure describes how to update a rejected forecast.
To update a rejected forecast
Log in as Subordinate.
Navigate to Forecasts Screen. The status for the forecast changes to Active.
Make changes to the forecast and resubmit it.
Updating Revenues from a Forecast
Updating revenues from a forecast allows a user to update live revenue records with the current forecast updates. This eliminates a number of steps. Updating revenues from a forecast only applies to forecasts with details.
After a user (manager or subordinate) edits the Adjustment field, that user can update the revenues in the Revenue screen by selecting the Update Revenue Item menu option. The Revenue field in the Forecast Detail record is then updated with the total of the adjustment and the previous revenue value, and the Adjustment value is reset to zero.
Managers can update their own revenues and a subordinate’s revenues under the following circumstances:
If the forecast detail depth is Revenue Detail, managers can update a subordinate’s revenues and their own revenues
If the forecast detail depth is Summary Only or Standard, managers can update their own revenues only
Subordinates can update their own revenues for forecasts with a detail depth of Revenue Detail, Standard, or Summary.
Updating Revenues Containing Custom Fields
Any custom fields added to the Revenue business component are not by default updated when a user selects Update Revenue Item.
To enable the updating of custom revenue fields, the user must add a Revenue Field Map: Forecast Item Detail Field Name user property to the Forecast 2000 -- Forecast Item and Forecast 2000 -- Forecast Item Detail business components with a value of Corresponding Revenue Custom Field Name.
For example, if a user has added the custom field Global Business Unit to the Revenue and Forecast Item Detail business components, the following user property must be added to the Forecast 2000 -- Forecast Item Detail business component:
Revenue Field Map: Global Business Unit
Value: Global Business Unit
For more information about this user property, see Forecast 2000 - Forecast Item User Properties.
To update revenue items from a forecast
Navigate to the Forecasts screen.
In the Forecasts list, drill down on the forecast to be updated.
In the Details view, select the revenue item to be updated.
Click the menu button, and then click Update Revenue Item.
This updates the revenue item with the most recent adjustment from the Forecasts screen.
Updating a Forecast with a Revenue Item
Updating a forecast with a revenue item updates the selected forecast with the most recent adjustment in the live revenue records. Updating a forecast with a revenue item only applies to forecasts with details.
To update a forecast with a revenue item
Navigate to the Forecasts screen.
In the Forecasts list, drill down on the forecast to be updated.
In the Details view, select the revenue line item or items you want to update.
Click the menu button, and then click Update Detail with Revenue Item.
About Analyzing Forecasts
Forecasts can be analyzed a number of ways.
Using Charts to Analyze Forecasts. Users can view forecasts by clicking the Chart hyperlink in either the Details view or the Summary view in the Forecasts screen. It is possible to view forecasts by month, quarter, or year from the Chart view. Also, depending on access privileges, users can compare individual forecasts from the My Forecast Analysis view, the My Team’s Forecast Analysis view, and the All Forecast Analysis view. In the Forecast Analysis view, users can select or highlight the forecasts they want to compare and the summary data is automatically aggregated. Then they can use the charts to see, for example, revenue by forecast by month.
To use the Charts view, the Chart Server must be configured.
Using Reports to Analyze Forecasts. For information about running reports, see Siebel Fundamentals.
Using Analytics to Analyze Forecasting. For more information about Oracle Business Intelligence Applications, formerly known as Siebel Business Analytics Applications, see the relevant documentation for the version of the software that you are running:
For versions earlier than 7.9, see Oracle's Siebel Business Analytics Applications documentation.
For versions 7.9 or higher, see the Oracle Business Intelligence Applications documentation.
For more information about the analytics platform on which your analytic application runs, see the relevant documentation for the version of the platform that you are running:
For versions earlier than 10.1.3.2, see the Siebel Business Analytics Platform documentation.
For versions 10.1.3.2 or higher, see the Oracle Business Intelligence Enterprise Edition documentation.