Line Charts
A line chart is a type of chart that displays trends across categories or over time. This topic shows examples of different line charts.
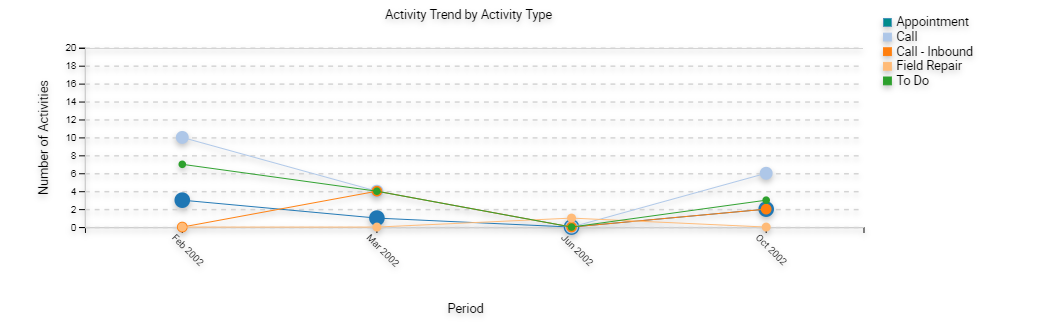
Two Dimensional Line Chart
The following figure shows a two dimensional line chart that displays one or more lines plotted against an X-Y grid. If a series axis does not exist, then Siebel CRM displays a single line. If a series axis does exist, then Siebel CRM displays one line for each color in the legend.
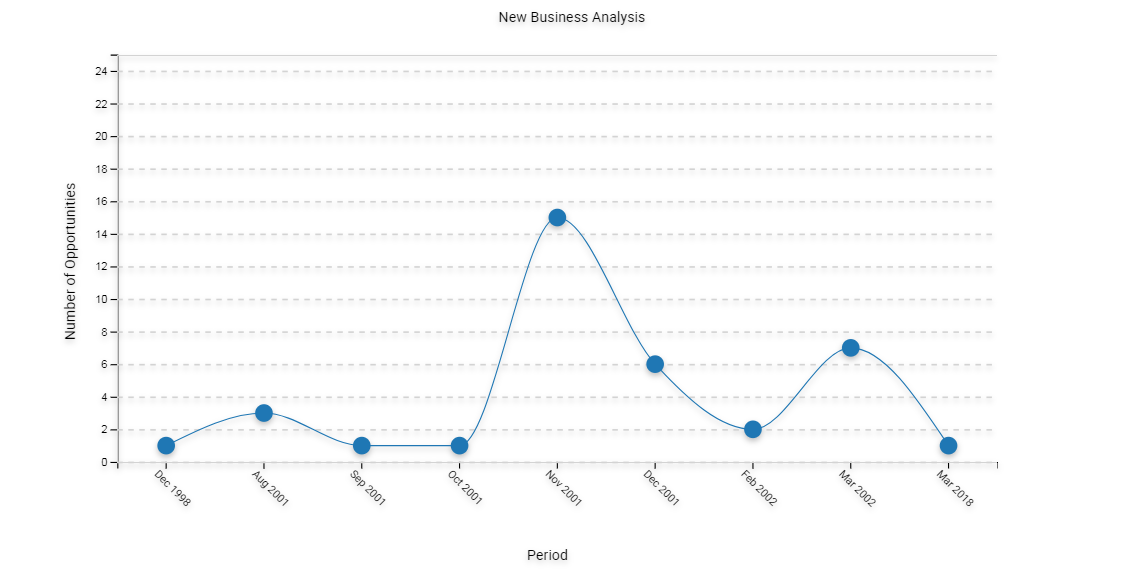
Two Dimensional Spline Line Chart
The following figure shows a two dimensional spline line chart that displays one or more lines plotted against the X-Y grid with the points plotted accurately but the line between points smoothed mathematically:-
If a series axis does not exist, then Siebel CRM displays a single line and set of points.
-
If a series axis exists, then Siebel CRM displays one line and the corresponding set of points for each color in the legend.
Combo Line Chart
The following figure shows a Combo line chart that displays a single bar chart with superimposed dots. The two charts share the category axis but each chart includes separate data points axes that Siebel CRM displays in the following ways:
-
On the start of the graph for the bar chart
-
On the end of the graph for the line chart
