Understanding Analytic Grid Design
The analytic grid retrieves data from the analytic server and displays it in a grid format on a PeopleSoft Pure Internet Architecture page. This grid is the centerpiece for the Analytic Calculation Engine user interface, enabling end users to view, edit, and drag and drop data from an analytic model's cube collection.
Note: Within an application, a PeopleSoft Pure Internet Architecture page that contains an analytic grid may be referred to as an interactive report. Interactive reports are typically read only, but in some cases may also be editable.
Constructing a PeopleSoft Pure Internet Architecture pages that contain an analytic grid consists of these basic steps:
In PeopleSoft Application Designer, create an analytic model.
See Understanding the Analytic Model Definition Creation Process.
Use PeopleSoft Application Designer to design the page that contains the analytic grid.
See Understanding PeopleSoft Application Designer, Using PeopleSoft Application Designer.
Insert the analytic grid into the page and associate the grid with the analytic model by using the Analytics tab in the Analytic Grid Properties dialog box.
Define the initial layout and characteristics of the analytic grid.
Producing an analytic grid involves many of the same tasks as generating a regular grid. These include inserting and resizing grid controls, inserting and manipulating grid columns, and setting column properties. In addition, you set certain analytic grid properties by using the Analytics tab, Use tab, Label tab, and General tab in the Analytic Grid Properties dialog box.
See Setting Column Properties for Analytic Grids, Setting Analytic Grid Label Properties, Setting Analytic Grid Use Properties, and Setting Analytic Grid General Properties.
You can also control the analytic grid layout programmatically using analytic grid APIs.
You can populate the grid with data in two ways: use the PeopleCode analytic grid classes or have the system populate the analytic grid with data automatically.
See Understanding the Analytic Calculation Engine Classes, Using the Analytic Grid in PeopleCode.
To populate the analytic grid data automatically:
Select to access PeopleSoft Application Designer.
After signing in to the PeopleSoft Application Designer, create or open a page definition.
Insert into the page any control from which you can obtain analytic instance values—for example, an edit box.
Set this control's properties to the analytic instance (select the appropriate record and field name on the Record tab).
This will be the analytic instance field you select in the Analytics tab of the Analytic Grid Properties dialog box.
Drag the appropriate record onto the grid.
Although the developer determines the initial layout of the analytic grid using PeopleSoft Application Designer, one of the primary advantages of the analytic grid is that end users can also modify the layout of the grid at runtime. Among other things, end users can use the analytic grid to:
Pivot data—for example, swap row and column orientations.
Perform hierarchy-related actions such as expanding, collapsing, drilling in, and drilling out in the data.
Slice data, for example, view a subset of a multidimensional array.
Hide non-dimensional fields.
Modify data.
Save the current view settings.
Restore the defaults as specified by the application.
You design analytic grids using PeopleSoft Application Designer. In addition, you may need to work with analytic grids in the runtime environment.
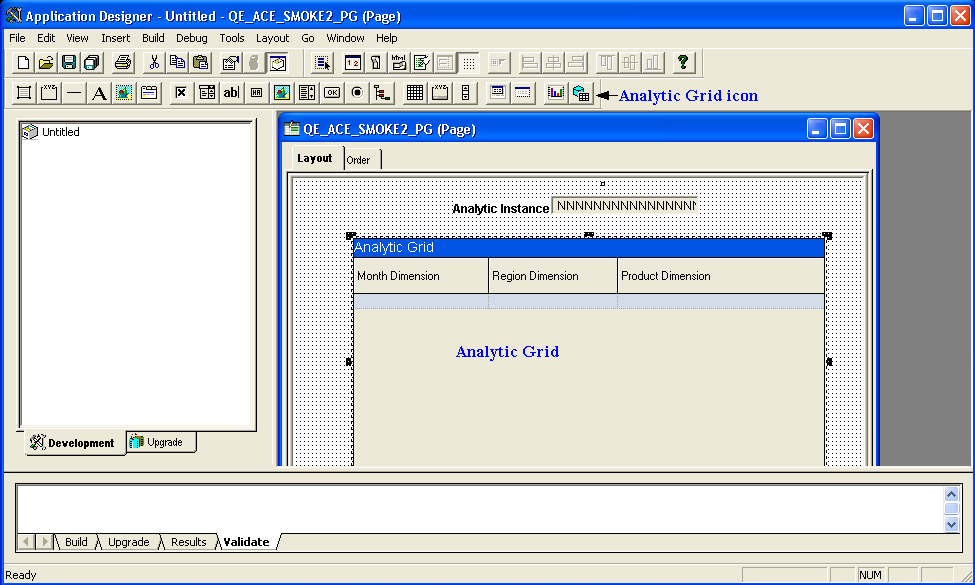
Image: Analytic grid in PeopleSoft Application Designer
This example shows the PeopleSoft Application Designer areas used to create analytic grids.
|
Field or Control |
Definition |
|---|---|
| Analytic Grid button |
Select and then drag to insert an analytic grid into the page. |
| Analytic grid |
Contains the grid itself. You can modify the grid's properties by double-clicking to display the Analytic Grid Properties dialog box. (Click anywhere except the column headings.) You can also double-click a grid column to display the properties box for modifying the column. In addition, you can change the order of columns on either the Layout or Order tab. |
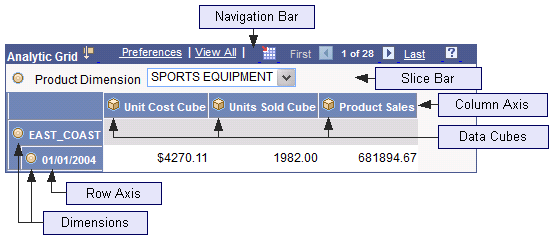
Image: Analytic grid at runtime
This example shows the areas in the Analytic Grid section used to modify analytic grids at runtime.
|
Field or Control |
Definition |
|---|---|
| Navigation Bar |
Enables end users to navigate through the displayed data set. Also contains a link to drag and drop instructional text. |
| Slice Bar |
Enables end users to view selected portions, or slices, of the data, for instance, the sales of one category of product or the sales from a single region. |
| Column Axis |
Displays the designated cubes or dimensions across the top of the analytic grid. Also contains icons for expanding or collapsing items. Note: Dimension on Column Axis can be expanded up to only four levels. |
| Row Axis |
Displays the designated cubes or dimensions along the left-hand side of the analytic grid. |
| Data Set |
Displays the data from the loaded analytic instance. |