Viewing the Application Dashboard
Access the Application dashboard. ()
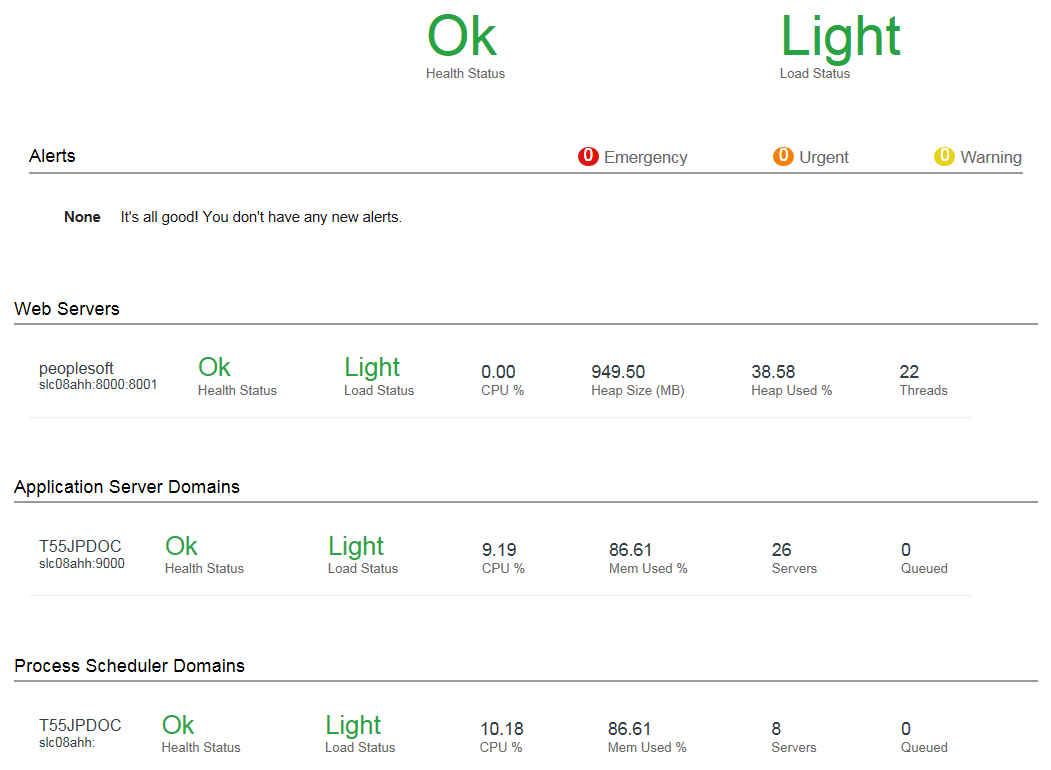
The dashboard displays monitoring data for the components or domains you enabled for monitoring.
Image: Application Dashboard
This example illustrates the fields on the Application dashboard. You can find definitions for the fields later on this page.
|
Field or Control |
Definition |
|---|---|
| Health Status (overall) |
Displays the overall health of an application, which is an aggregate of statuses across all domains and servers participating in the application. Possible values are:
The overall health status of an application is determined by PeopleTools heuristics. |
| Load Status (overall) |
Displays the overall performance status of an application, which is an aggregate of statuses across all domains and servers participating in the application. Possible values are:
The overall load status of an application is determined by PeopleTools heuristics. |
| Alerts |
Displays the active alerts for the application. Possible categories are:
PeopleSoft Health Center enables you to configure metric alerts. Metric alerts are associated with graphs. On each dashboard, in the header of a section associated with a graph, an Alert Setup icon is displayed, which allows you to configure metric alerts. |
| Web Servers |
Displays a PIA server in the application and provides the overall health and status of the domain, which includes the following information.
Note: In PeopleTools 8.55, PIA deployed on WebLogic is supported. |
| Application Server Domains |
Displays an application server domain and provides the overall health and status of the domain, which includes the following information.
Note: If the system CPU or virtual memory usage is consistently high, add more hosts to share the workload. |
| Process Scheduler Domains |
Displays a Process Scheduler domain and provides the overall health and status of the domain. The diagnostic parameters are similar to the application server domain. |