Using PeopleSoft Update Manager (PUM) Analytics
The Update Manager Dashboard provides analytics for PUM (PeopleSoft Update Manager) that assist in determining your current level of maintenance. The Update Manager Dashboard is available on the PeopleSoft Update Image. The various pivot grids provided on the dashboard, provide access into the maintenance logs and bug information for each database uploaded to the PeopleSoft Update Image.
By default the Update Manager Dashboard has twelve tiles with the following pivot grids:
Database Bug Status
Bugs by Tag
Bugs by Product
Bugs by Image
Enhancements by Image
Enhancements by Product
Enhancements by Minimum Tools
Applied Bugs by Image Lag
Multilingual Bugs by Language
Bugs by Image
Applied From Bugs by Dependency
Customization Impacts by bug
Bugs are categorized by into four distinct groups:
Applied Bug Fixes for installed products
All bug fixes that have been applied to the target database for installed products.
Applied Bug Fixes for non-installed products
All bug fixes that have been applied to the target database for non-installed products.
Unapplied Bug Fixes for installed products
Use the unapplied bug fixes for installed products to determine how far behind the target database is compared to the current PeopleSoft Update Image. If there are no unapplied bug fixes for installed products, the target database is current.
Unapplied Bug Fixes for non-installed products
Unapplied bug fixes for non-installed products will not have any effect on target database.
Displaying Analytics
To display analytics for a specific target database and pivot grid:
Expand the Select Target Database folder and click the link for the database to display.
Click on one of the pivot grid tiles to open Pivot Grid Viewer.
Use the Show Filters icon to display the available filters on the left-hand side of the pivot grid.
The grid showing the bugs that match the filter criteria is displayed.
Applying Filters
Use the Show Filters icon to display the available filters on the left-hand side of the pivot grid. Once you select a filter, the pivot grid will be refreshed with the current filters. The following filters are available for the pivot grids:
Bug Status
Applied or Unapplied
Image
Bug Severity
Product
Product Installed
Component
Sub Component
Reviewing the Grid
Once you open a pivot grid and apply the filters, all of the bugs meeting the specified criteria are displayed with the following columns:
Action check box
Database
Bugs
Image Number
Subject
Bug Severity
Bug Status
Product Name
Product Installed
Component
Sub Component
Posted date
Certain pivot grids have additional columns:
Bugs by Tag includes columns for Tag Name and Tag Value.
Enhancements by Minimum Tools includes a column for Minimum Tools.
Applied Bugs by Image Lag includes a column for Image Lag.
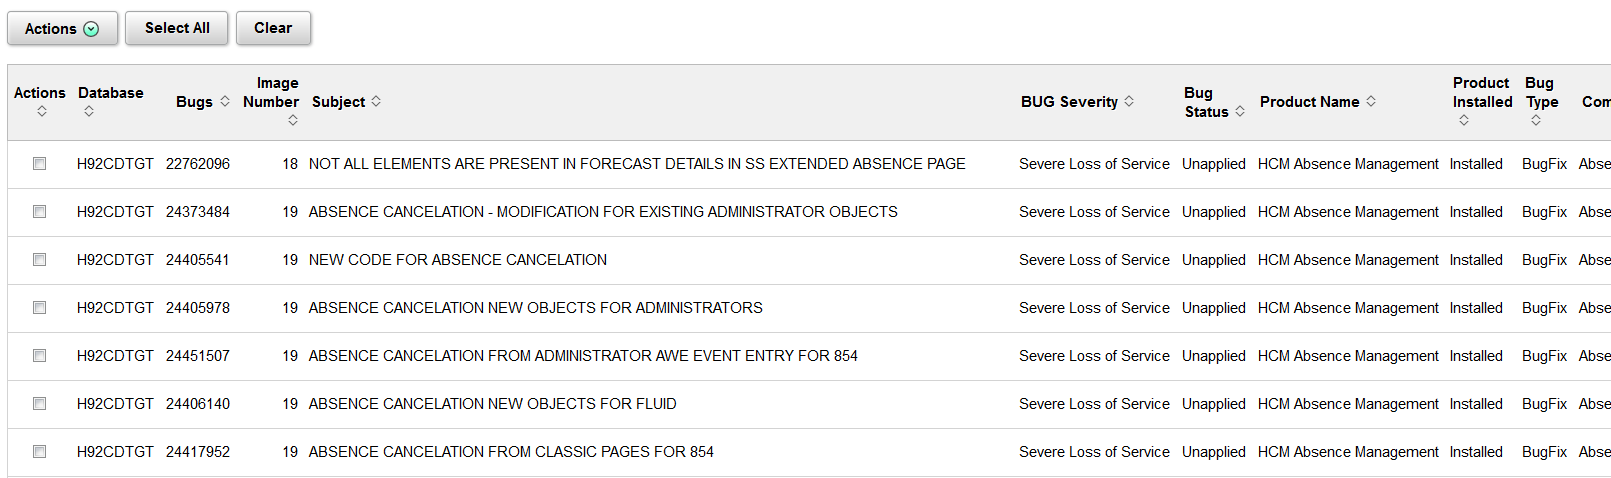
Image: Example Grid
This example illustrates the fields and controls on the grid. You can find definitions for the fields and controls later on this page.
|
Field or Control |
Definition |
|---|---|
| Actions |
After selecting bugs, by checking the Actions column in the grid, use the Actions drop down to select Add to Change Package. |
| Select All |
Click this button to select all bugs. |
| Clear All |
Click this button to clear all bugs. |
To use the pivot grid to select bugs for your change package:
Double-click the pivot grid.
Set the filters to use.
You may want to include the filter for Unapplied.
Review the bugs listed in the grid and select the Action check box for the bugs you want to include in your Change Package.
Image: Selecting bugs from the grid
This example illustrates bugs selected to add to a change package.
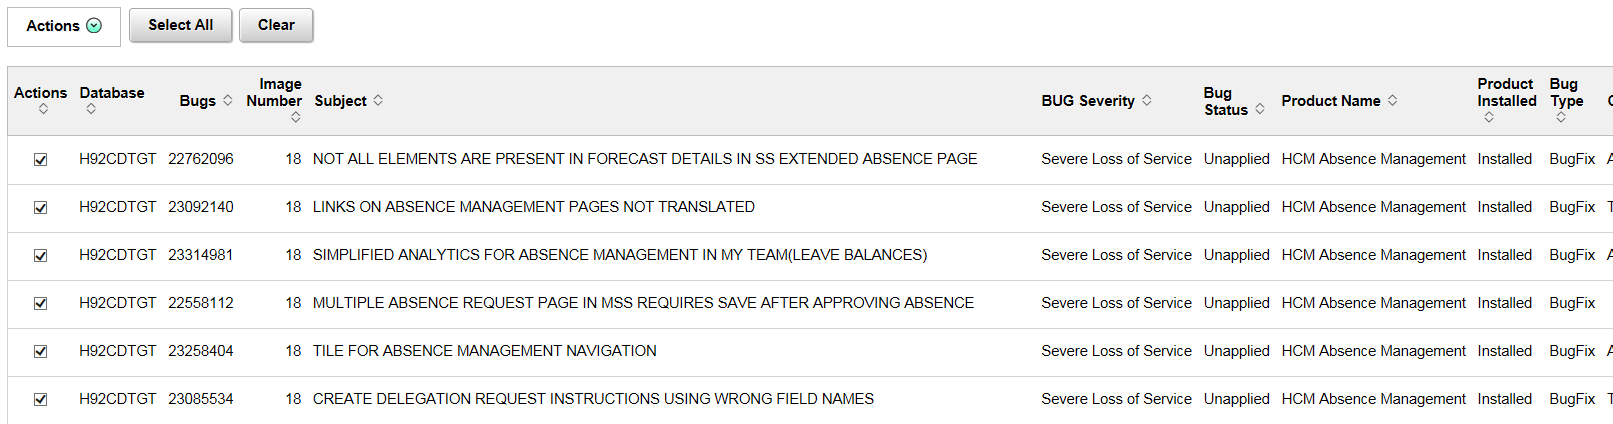
Click the Actions drop down and select Add to Change Package.
The Enter Change Package Name page is displayed.
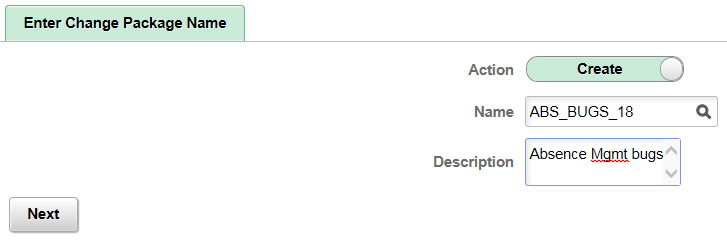
Image: Enter Change Package Name
This example illustrates the fields and controls on the Enter Change Package Name. You can find definitions for the fields and controls later on this page.
Field or Control
Definition
Action By default the action is Create. If you want to add the bugs to an existing Change Package that has not been applied, select Edit.
Name Enter a name for the change package. If the action is Edit, select an existing package.
Description Enter a description.
Click Next.
The change package wizard will open on Step 5 of 6.
This pivot grid displays the status of all installed products. Use the filters to determine what bugs need to be applied.
Image: Database Bug Status
This example illustrates the fields and controls on the Database Bug Status pivot grid. This example displays the pivot grid filtered by Installed products and Complete Loss of Service.
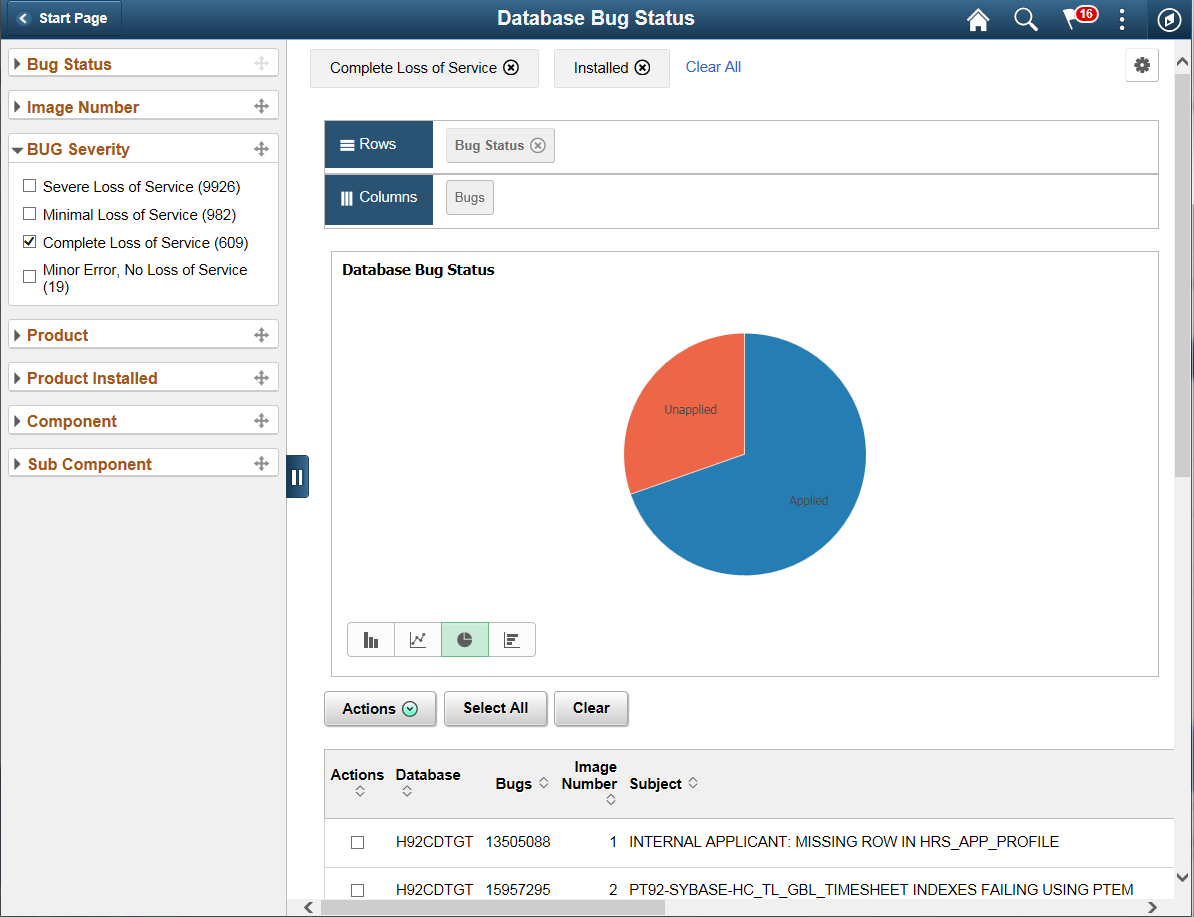
This pivot grid displays the status of all installed products. Use the filters to determine what bugs need to be applied.
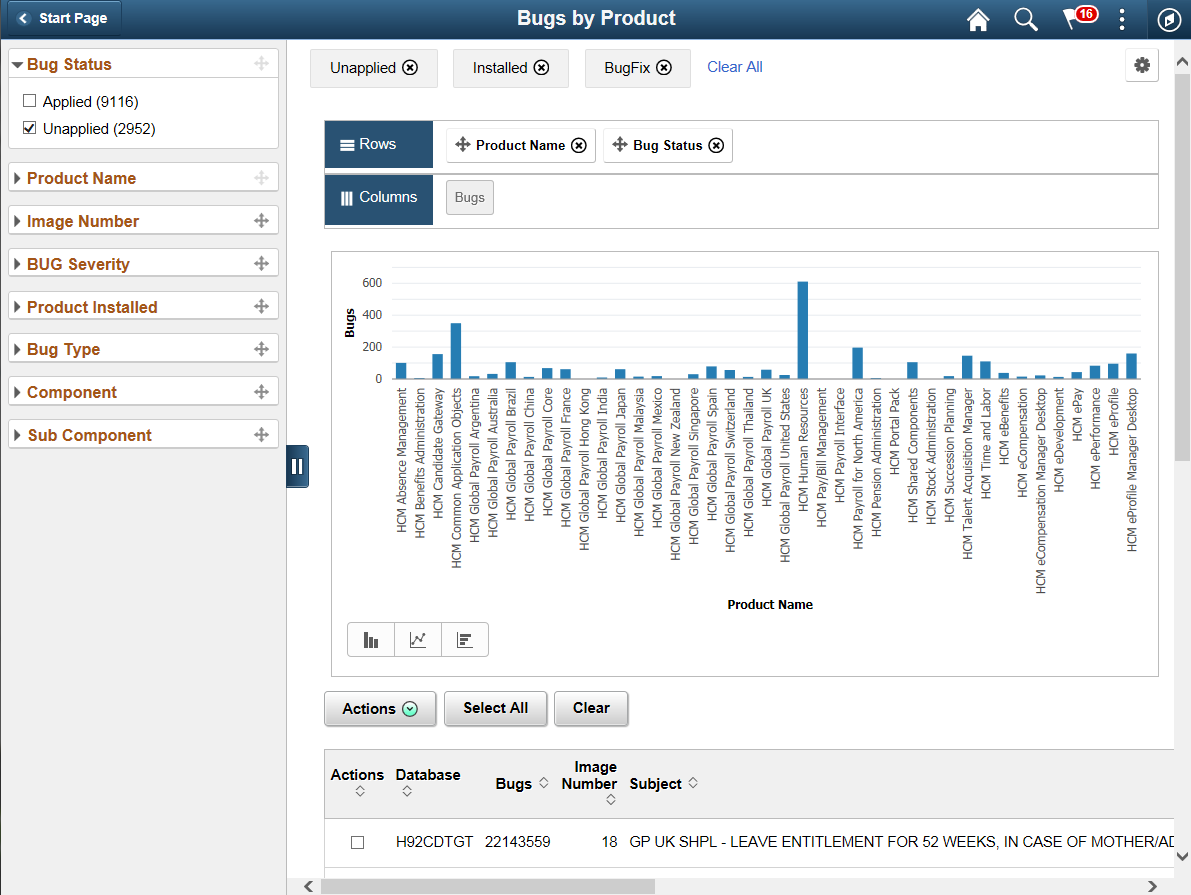
Image: Bugs by Product
This example illustrates the fields and controls on the Bugs by Product. In this example the filter was changed to show unapplied bugs.
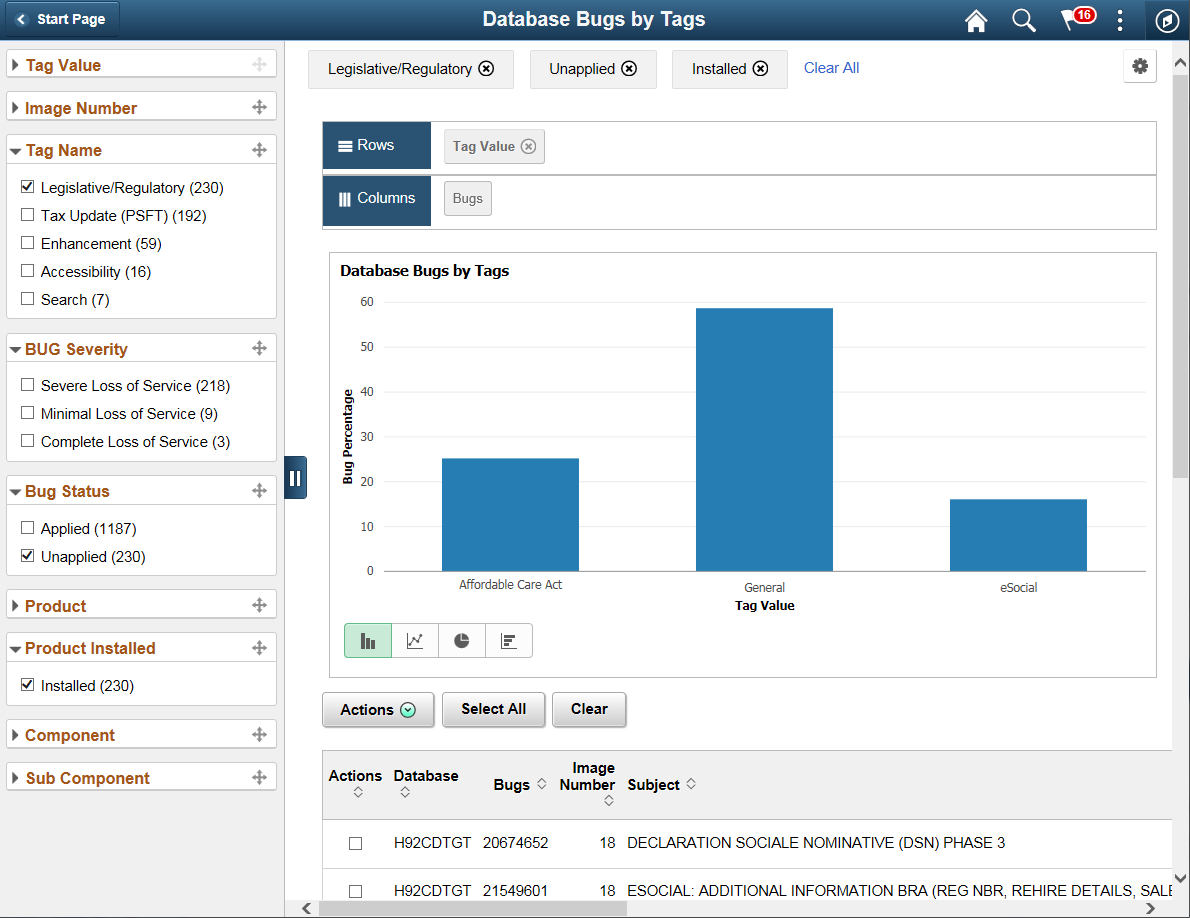
This pivot grid displays bug status by tag. Tag types will vary depending on the application. Use the filters to narrow down the search.
Image: Database Bugs by Tags
This example illustrates the fields and controls on the Database Bugs by Tags. This example id filtered by tag name, unapplied and installed products..
This pivot grid displays the bug status by Image, which can be used to track your maintenance strategy.
Image: Bugs by Image
This example illustrates the fields and controls on the Bugs by Image. This example shows a database that is current through image 17.
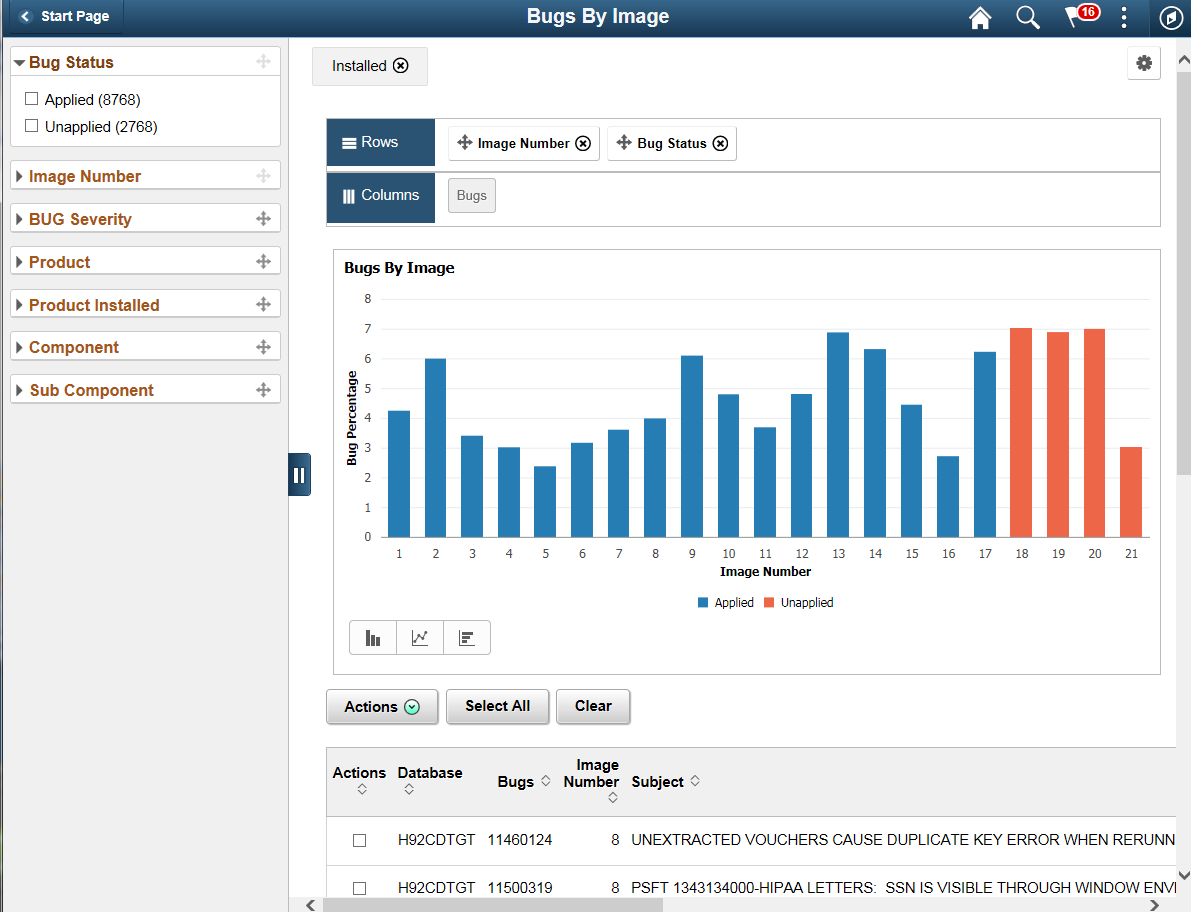
Note: When filtering the Bug Status by Image pivot grid, select only one Product Status at a time.
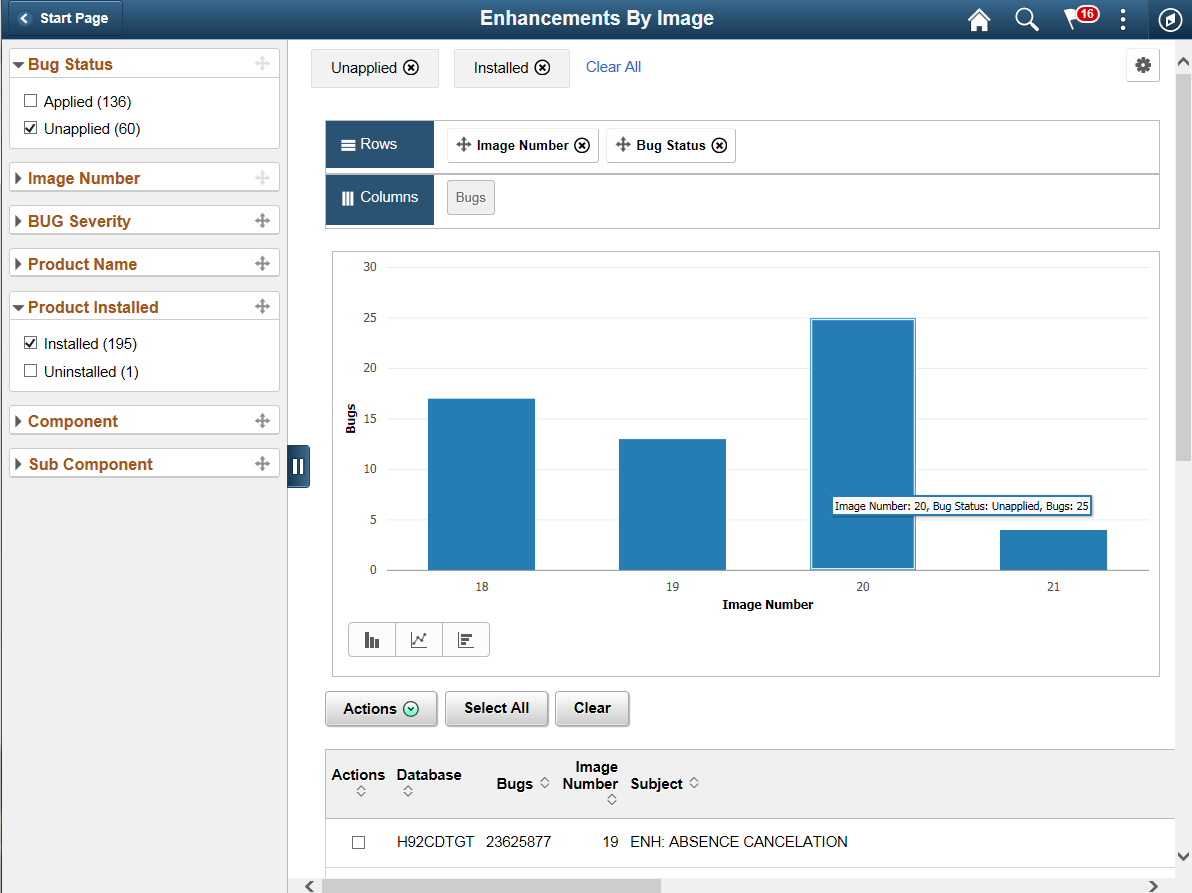
This pivot grid displays the enhancements (and no bugs) by Image, which can be used to determine which enhancements have been applied and which enhancements you would like to apply.
Image: Enhancements by Image
This example illustrates the fields and controls on the Enhancements by Image pivot grid.
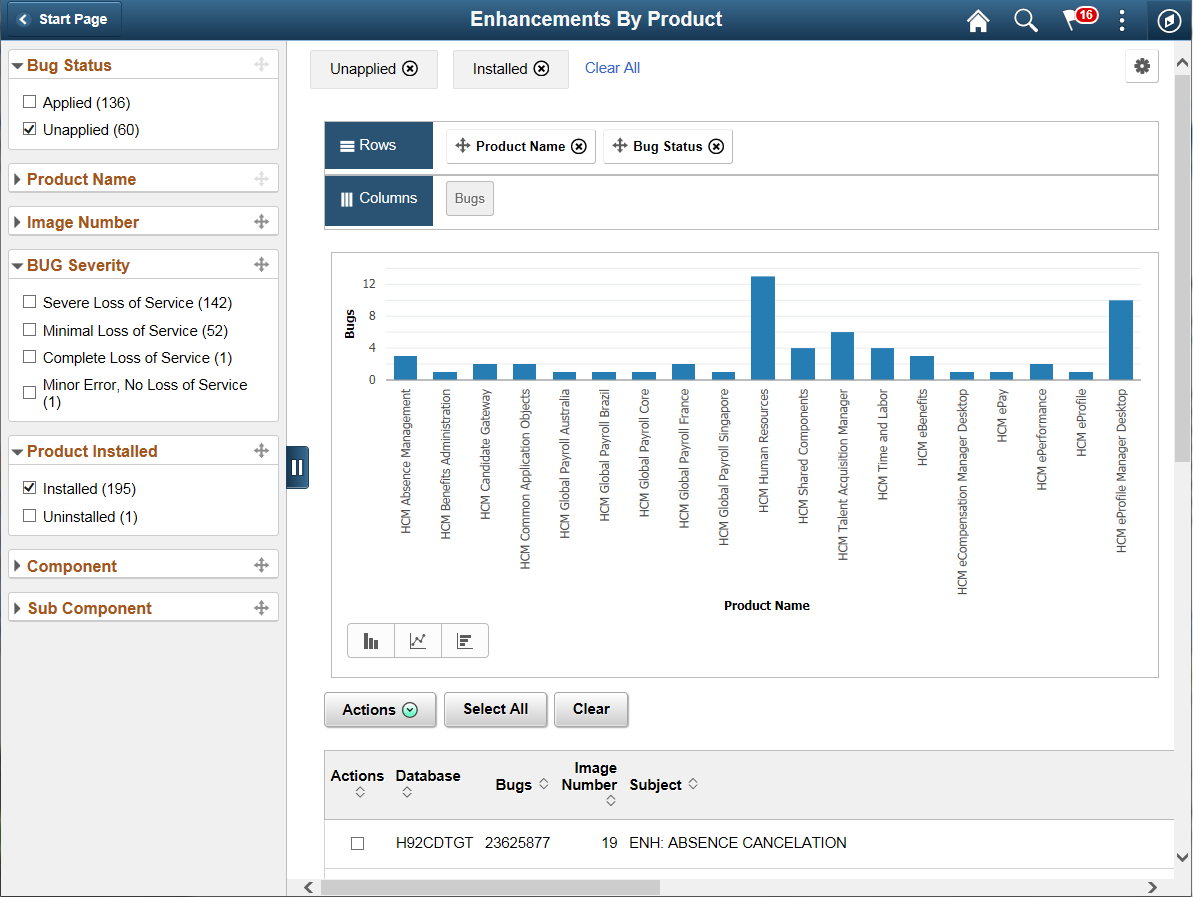
This pivot grid displays the enhancements (and no bugs) by product, which can be used to determine which enhancements for a product have been applied and which enhancements you would like to apply.
Image: Enhancements by Product
This example illustrates the fields and controls on the Enhancements by Product.
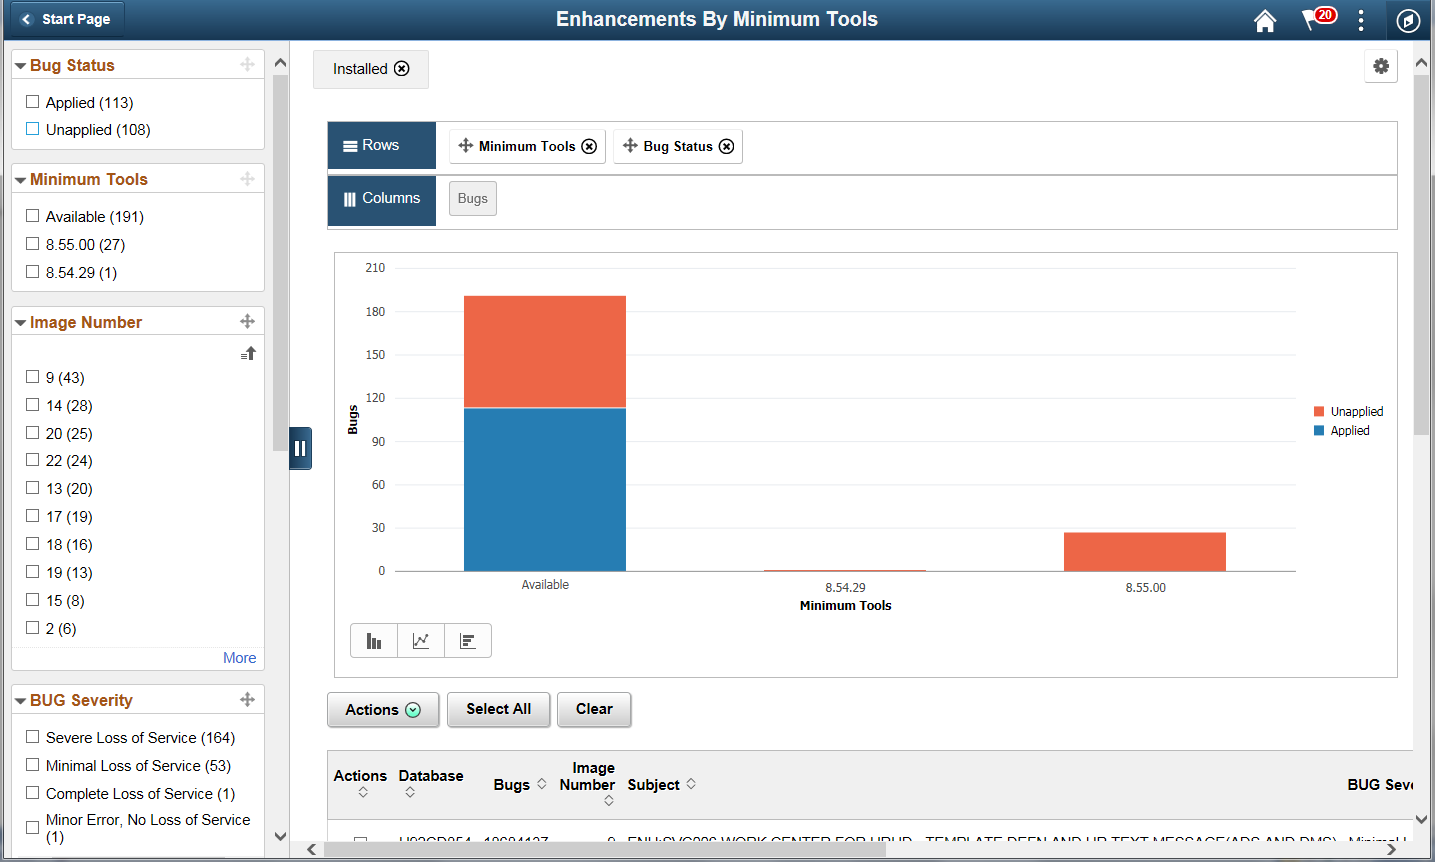
This pivot grid displays the enhancements (and no bugs) that are available based on PeopleTools release for the target environment.. Use this pivot grid to determine which enhancements you can apply to your current target database, as well as what enhancements are available when you upgrade to a newer version of PeopleTools..
This example shows a target database on 8.54.16. There are 191 enhancements that could be applied to the current target on 8.54.16, one enhancement that requires 8.54.49 and 27 that require 8.55.
Image: Enhancements by Minimum Tools
This example illustrates the fields and controls on the Enhancements by Minimum Tools for a target database that is on 8.54.16.
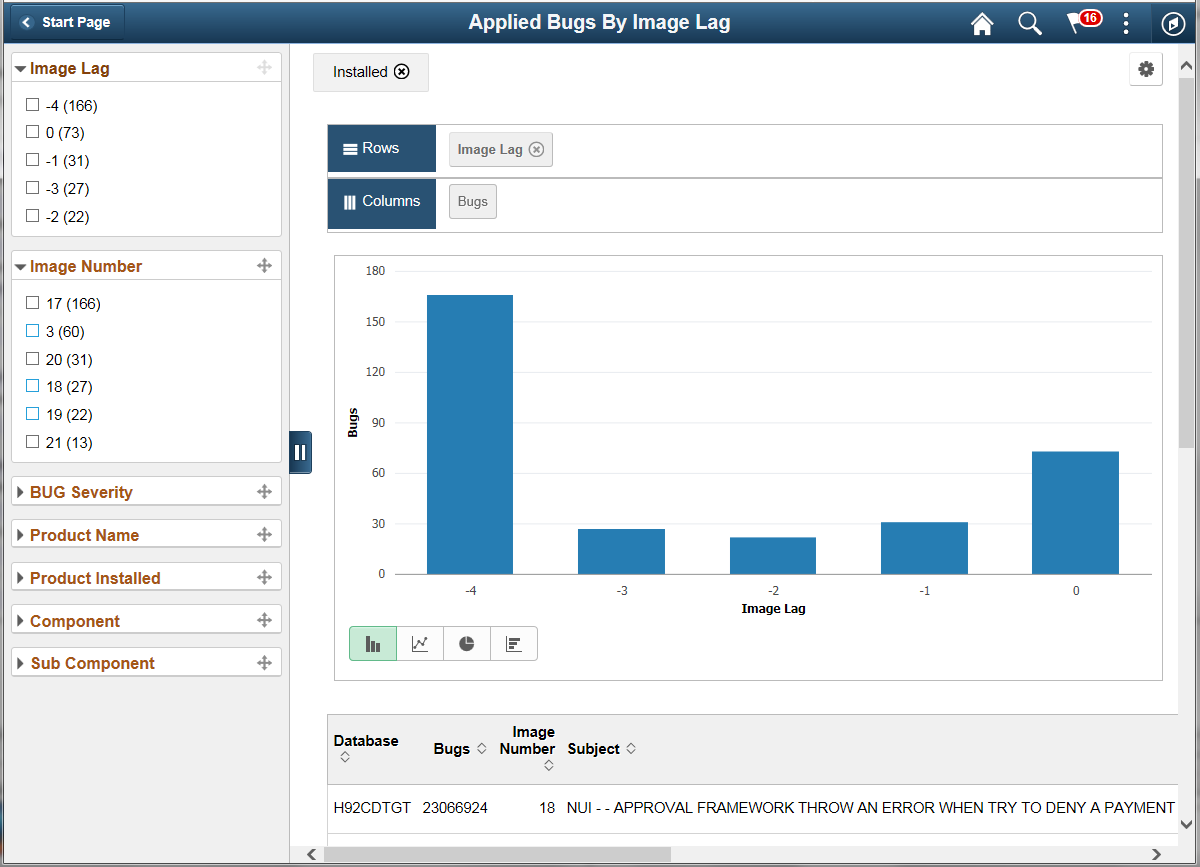
This pivot grid describes the relative time to apply fixes in the system. This analytic shows the difference between when the change is delivered versus when the change is applied. If a bug is delivered in PI 15 and the customer applies the bug in PI 15, then it is 0. If the customer does not apply the bug until PI 16, it will show as -1.
Note: If you upgrade your 9.1 application to an image point, for example PI 20, no data for lag time will be available because there will not be any applied packages defined in the database.
Image: Applied Bugs by Lag Image
This example illustrates the fields and controls on the Applied Bugs by Lag Image. In this example, the current PI is 21 (0). For the bugs you have applied using PI 21, you can see the PI when the bug was available, image 20 (-1,) image 19 (-2), image 18 (-3), and image 17 (-4).
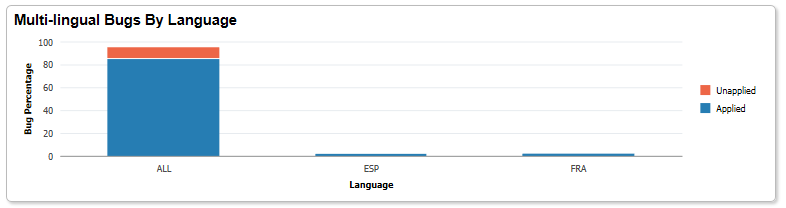
This pivot grid displays the multi-lingual fixes available for installed languages on the target. If the target database is English no data will appear in the pivot.
Image: Multi-lingual Bugs By Language
This example illustrates the fields and controls on the Multi-lingual Bugs By Language. You can find definitions for the fields and controls later on this page.
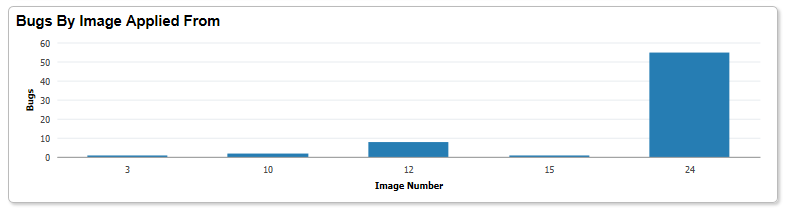
This pivot grid displays all bugs and enhancements based on the image they were applied from.
Image: Bugs By Image Applied From
This example illustrates the fields and controls on the Bugs By Image Applied From. You can find definitions for the fields and controls later on this page.
This pivot grid displays the number of dependencies each bug that has not been applied on the target database. You can view information on bugs, enhancements or both using the filter option. By default both are displayed.
The x axis for this analytic contains number ranges rather than the actual number of dependencies. This limits the number of vertical bars in the grid to provide better usability, given the actual dependency data could have 1000’s of possible values.
This pivot grid displays the number of bugs that have not been applied on the target database that have a customization impact.
Data is only displayed on this pivot grid if:
Customer data on customizations has been uploaded to the PUM Source.
The Customization Calculation has been run on the PUM Source.