Using the PeopleSoft Fluid User Interface to Work with Time and Labor as an Administrator
This topic discusses how administrators use the PeopleSoft Fluid User Interface to perform absence-related transactions.
For general information about fluid pages in PeopleSoft HCM, see Understanding PeopleSoft Fluid User Interface Home Pages
|
Page Name |
Definition Name |
Usage |
|---|---|---|
|
HC_TIME_ADMIN_FL(this is the cref for the tile) |
Select to access the navigation collection which lists Reported Time Audit and Time and Labor WorkCenter. |
|
|
TL_AUD_RPTTIME_FL |
Access view current reported punch and elapsed time. |
|
|
TL_WC_RSLT_FL |
Access various business processes to complete day-to-day work and commonly performed tasks. |
Administrators use the Time and Labor tile to access Reported Time Audit and Time and Labor WorkCenter components.
Navigation
Select Fluid Home under the main menu. On the page that appears, select Workforce Administrator. The Time and Labor tile is available on the Workforce Administrator landing page.
Image: Time and Labor tile
This example illustrates the Time and Labor tile.

Click the Time and Labor tile to access the Time and Labor application start page.
Image: Time and Labor Administration application start page
This example illustrates the Time and Labor Administration application start page for the tablet.

This application start page is a navigation collection that enables administrators to access Time and Labor Management components from one location. The left panel of this page lists the components collected under four categories:
Reported Time Audit
Time and Labor WorkCenter
The right panel displays the component selected in the left panel.
Use the Reported Time Audit page ( TL_AUD_RPTTIME_FL) to view current reported punch and elapsed time.
Navigation
Click the Time and Labor tile on the Workforce Administrator fluid home page
The default landing page is Reported Time Audit selected on the left panel.
The following video provides an overview of the Reported Time Audit page:
Image: Reported Time Audit Page
This example illustrates the Reported Time Audit Page for Elapsed Time Reporter.

Image: Reported Time Audit Page for Elapsed Time Reporter with history expanded
This example illustrates the Reported Time Audit Page for Elapsed Time Reporter with history expanded.

Image: Report Time Audit page_Overview tab for Punch
This example illustrates the Reported Time Audit Page for Punch Time Reporter.

Search Options
|
Field or Control |
Definition |
|---|---|
| Name |
Search the employee with Empl ID, First Name or last Name. |
| Start Date and End Date |
Enter the start and end date for the time you want to view. The system populates the fields with the data for all time reported from the start to the end date. |
 |
Click after you enter the start and end dates. The system retrieves the data for all the current reported time between the start and end dates. |
 |
Select the button Yes or No to see the audit history |
 |
Select to download the information in the form of a datasheet. |
| Time Reporting Code |
Displays the Time Reporting Code for the reported time that has a status of either Current or Delete. |
| Quantity |
Displays the quantity for the Time Reporting Code for elapsed reported time or the duration for matched punches for punch reported time. |
| Audit Date/Time |
Displays Audit date and time. |
| Audit History |
Click this link to see details about the changes that were made to the time. If the time is current and no changes were made to the time, this field is unavailable. If the link is available, then changes have occurred to the time; click the link to view them. |
Image: Reported Time Audit Page_Time Reporting Elements for Elapsed
Reported Time Audit Page Time Reporting tab for Elapsed Time Reporter

Image: Reported Time Audit Page_Time Reporting Element for Punch
Reported Time Audit Page Time Reporting tab for Punch Time Reporter

Image: Reported Time Audit Page_Task and Reporting Elements for Elapsed
Reported Time Audit Page Time Task and Reporting Elements tab for Elapsed Time Reporter

Image: Reported Time Audit Page_Time Reporting Elements for Punch
Reported Time Audit Page Time Reporting Element tab for Punch Time Reporter

Image: Reported Time Audit Page_Show All for Elapsed
Reported Time Audit Page Time Show All tab for Elapsed Time Reporter

Image: Reported Time Audit Page_Show All for Punch
Reported Time Audit Page Time Show All tab for Punch Time Reporter

The Time and labor Fluid WorkCenter is divided into four main sections – My Work, Links, Queries, and
Reports/Processes. You can expand each sections by clicking those sections.
For more information on how to use Classic Time and Labor WorkCenter, refer Using the Time and Labor WorkCenter
Image: Time and Labor WorkCenter Page
This example illustrates the fields and controls on the Time and Labor WorkCenter Page.

Image: Time and Labor WorkCenter (2_2) Page
This example illustrates the fields and controls on the Time and Labor WorkCenter (2_2) Page.

Users can personalize display options and add links to their own WorkCenter for maximum efficiency. For more information, see Setting Up and Personalizing PeopleSoft Fluid WorkCenters.
Conditional Navigation for Time and Labor WorkCenter
When administrators access the Time and Labor WorkCenter, they are taken to either the Fluid or non-Fluid version of the component depending on the presence of a user role. This behavior is known as conditional navigation.
If administrators are members of the Time and Labor Fluid WorkCenter user role, they are given access to the Fluid Time and Labor WorkCenter. Administrators without this role access the non-Fluid version of the WorkCenter on the Using the Time and Labor WorkCenter.
The WorkCenter page is divided into two areas: the navigation panel on the left and the transaction panel on the right.
Left Panel
The navigational panel on the left contains group boxes with links to specific transactions, menu components and other content. These group boxes are:
My Work. This group box contains six collapsible sections, Alerts, Exceptions, Approvals, Time Reporter Status, Attendance, and Unprocessed Time. For more information, see Understanding the My Work Group Box.
Links. For more information, see Understanding the Links Group Box.
Queries. For more information, see Configure Pagelets – Queries Page.
Reports/Processes. For more information, see Configure Pagelets – Reports/Processes Page.
|
Field or Control |
Definition |
|---|---|
| Scope |
Scope determines the data to be displayed in the WorkCenter. Note: If you have configured any additional scope, it will also be listed under the My Scope option. For more information on how to configure a new scope, see Configure Scope Page. |
 |
Click to refresh the content area to display either the first page that appears when you first access the WorkCenter, or the starting page if it is specified in your personalization. |
 |
Click to access these personalization options:
|
Image: Personalize Scope Page
This example illustrates the fields and controls on the Personalize Scope Page. You can find definitions for the fields and controls later on this page.
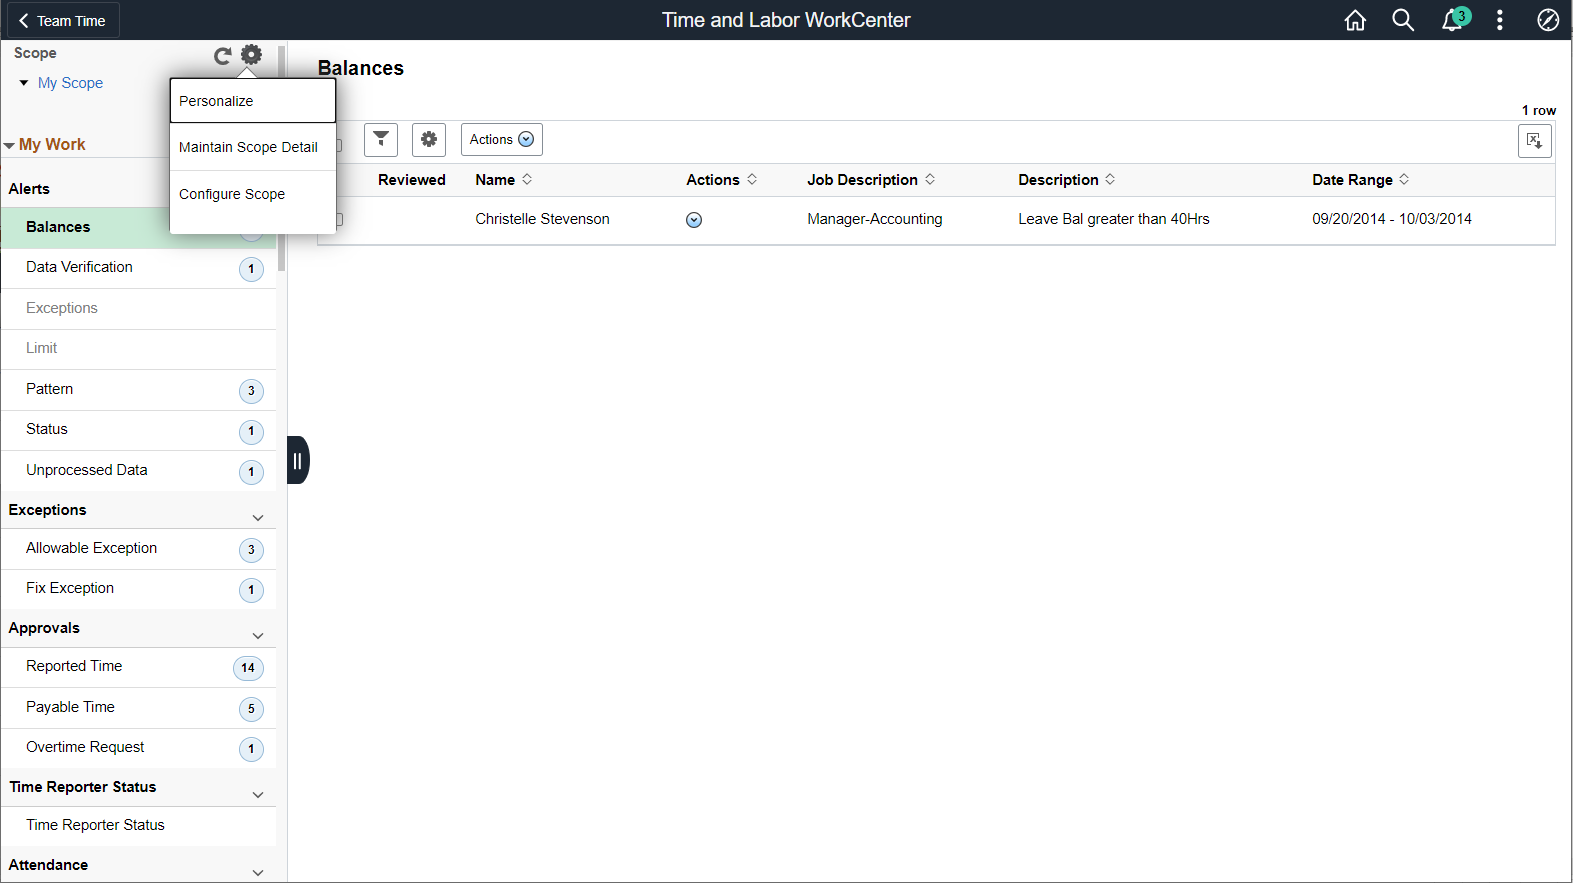
Image: My Scope_Personalized Output
This example illustrates the sample personalized output for one of the My work items.
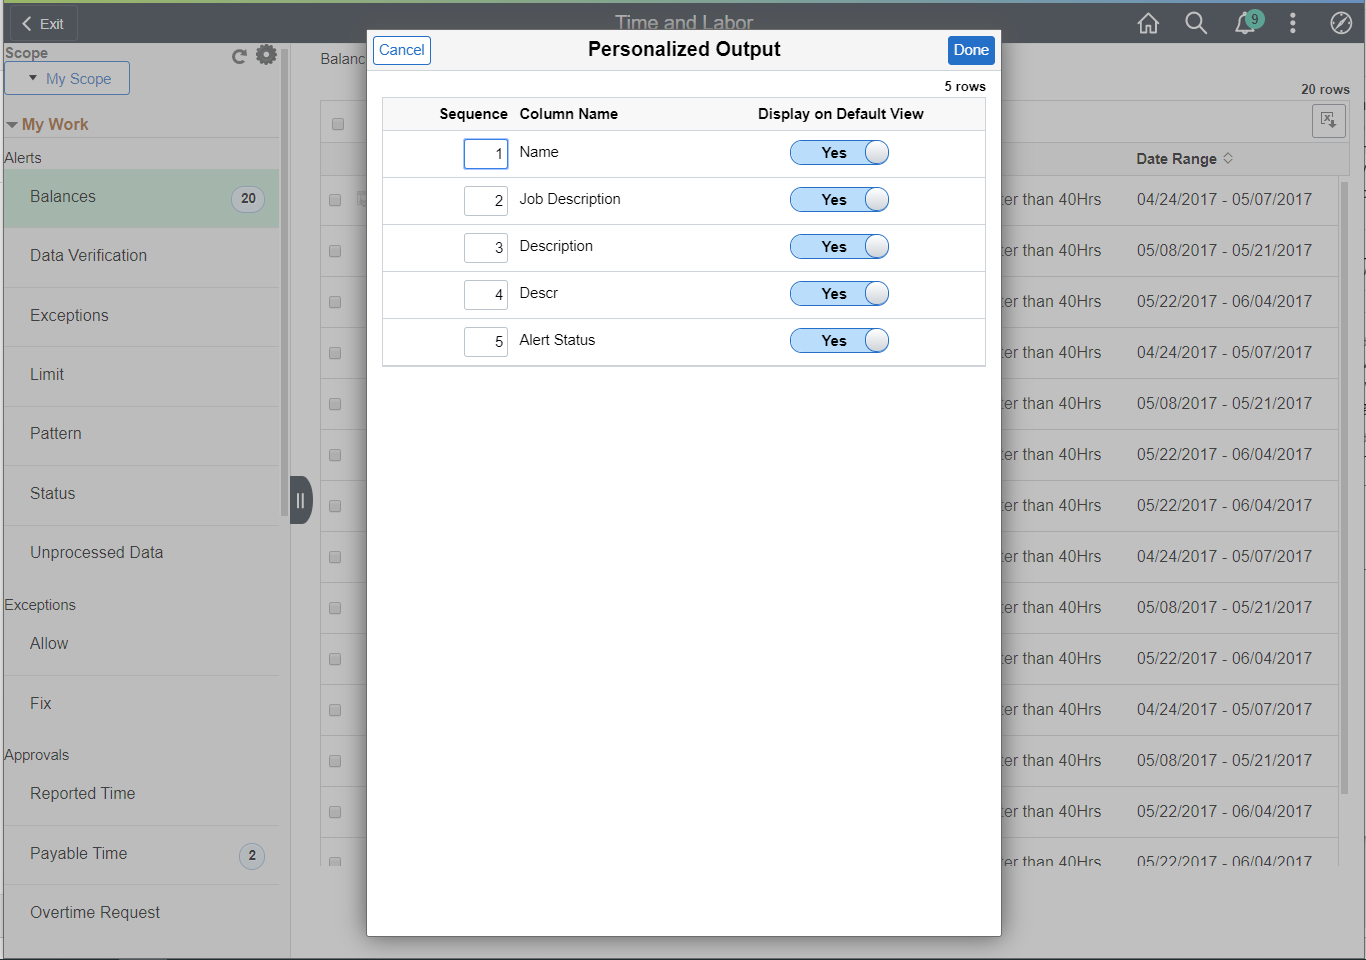
The modal for Personalized output provides an option to select the options to display on output.
Right Panel
The transaction panel on the right is where the selected transaction result or component (work item) is displayed.
By default, the first My Work item appears when you first access the Time and Labor WorkCenter. You can change this default setting of the WorkCenter on the .
You can also filter and personalize the output based on your requirements. Use the Refine Filter Criteria page to select one or more criteria to narrow the search result. The Filter icon appears green when filters have been applied to your search. Use the Personalized Output page to modify the position of columns and to select the columns to be displayed as default for each work item. For more information, see Personalize Page (Fluid).
You can also filter and personalize the output based on your requirements. Use the Refine Filter Criteria page to select one or more criteria to narrow the search result. The Filter icon appears green when filters have been applied to your search. Use the Personalized Output page to modify the position of columns and to select the columns to be displayed as default for each work item. For more information, see Setting Up and Personalizing PeopleSoft Fluid WorkCenters.
Use the Maintain Scope Detail (EOWC_EDITVIEWLK_FL) page to define the scope for My Work items.
Image: Maintain Scope Detail Page
This example illustrates the fields and controls on the Maintain Scope Detail Page. You can find definitions for the fields and controls later on this page.
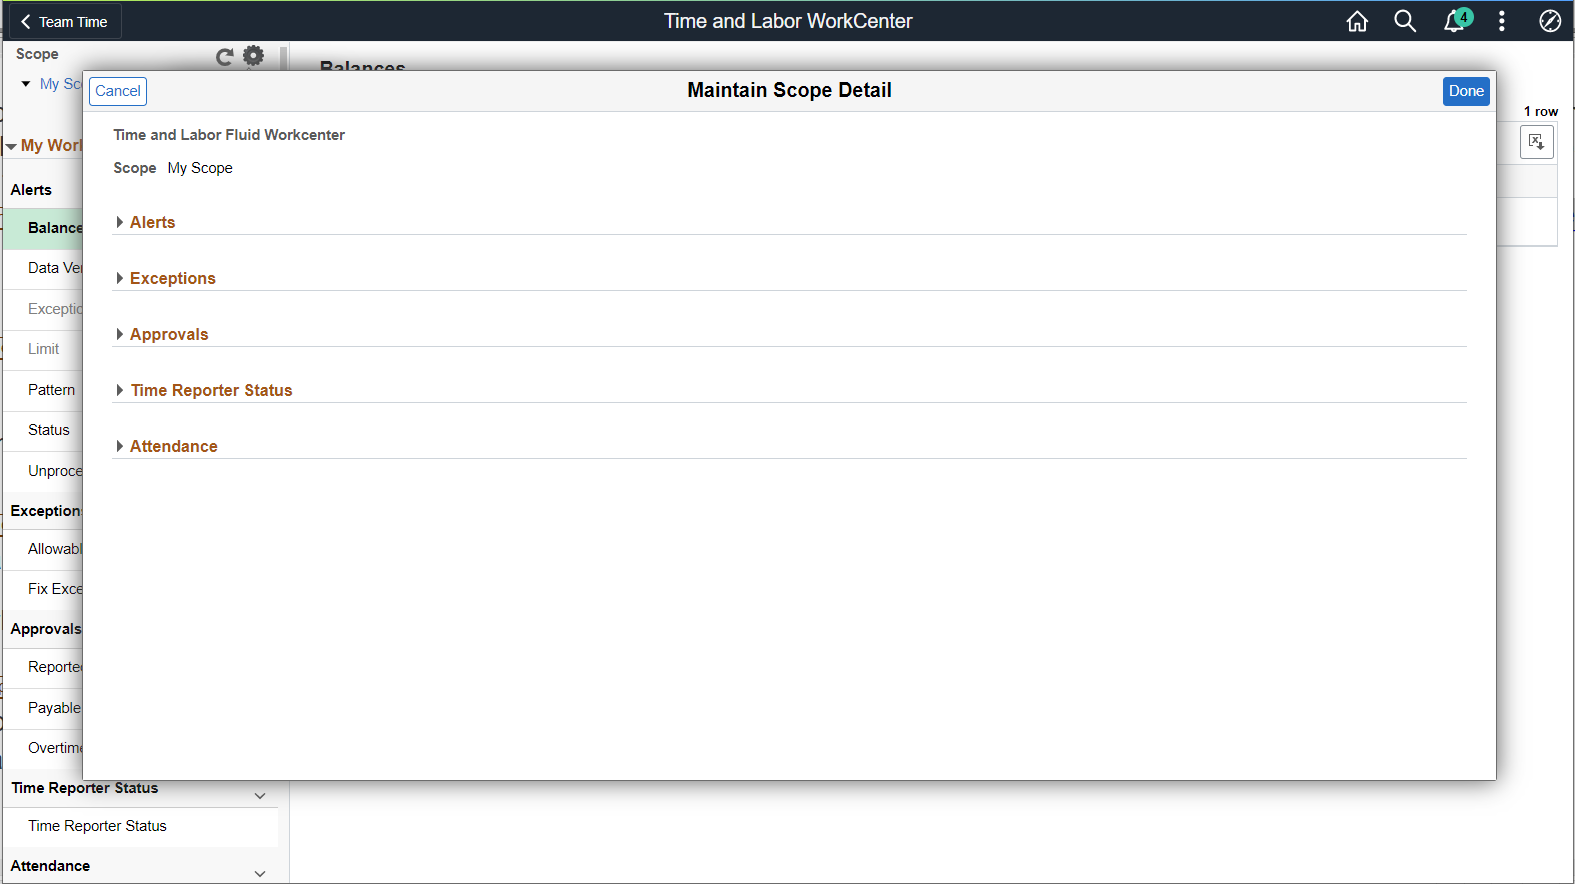
You can define the scope of alerts with Link Label, Description and Edit Filters. The Edit Filters enables you to define the scope values like date ranges.
The My Work group box provides Time and Labor work item links for alerts and exceptions in these group sections:
Alerts
Exceptions
Approvals
Time Reporter Status
Attendance
Note: Work item links are grayed out if no data is available for display.
Alerts
There are seven types of alerts available, they are Balances, Data Verification, Exceptions, Limit, Pattern, Status and Unprocessed Data.
For more details, refer Alert Type_Balances Page
Exceptions
Fix Exception Page
Approvals
There are Reported Time Approvals Page, Payable Time page and Overtime Request time page in Time and Labor Fluid WorkCenter.
Reported Time Status
Attendance
Use Reported Time Status page to view the Time administration status of the employees.
Image: Reported Time Status page
This example illustrates the fields and controls on the Reported Time Status page.

Use the Attendance Violations page (HWC_RSLT_FL) to view the list of employees with Attendance Violations.
Navigation
Click the Attendance Violations link under Attendance in the My Work group box of the Time and Labor WorkCenter.
Image: Attendance Violations Page
This example illustrates the Attendance Violations Page.

Image: Attendance Violation Page_Related Actions
This example illustrates the fields and controls on the Attendance Violation Page_Related Actions. You can find definitions for the fields and controls later on this page.

You can select the related action on the right panel to select Notify.
Use the Attendance Actions page (HWC_RSLT_FL) to view the list of employees whose time requires attendance actions.
Navigation
Click the Attendance Actions link under Attendance in the My Work group box of the Time and Labor WorkCenter.
Image: Attendance Actions Page
This example illustrates the Attendance Actions Page.

Image: Attendance Actions Page_Related Action
This example illustrates the fields and controls on the Attendance Actions Page_Related Action. You can find definitions for the fields and controls later on this page.

You can select the related action on the right panel to select Notify.
The Links group box provides access to the key components that are required to complete Time and Labor transactions.
Image: Link Group Box
This example illustrates the fields and controls on the Link Group Box.

System administrators can manage links and configuration options for the Queries Group Box on the Configure Pagelets – Queries Page
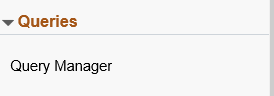
The Queries group box contains the Query Manager link. You can click this link to search for existing queries or create ones to use.
Image: Queries Group Box
This example illustrates the Queries Group Box.
System administrators can manage links and configuration options for the Queries Group Box on the Configure Pagelets – Queries Page.
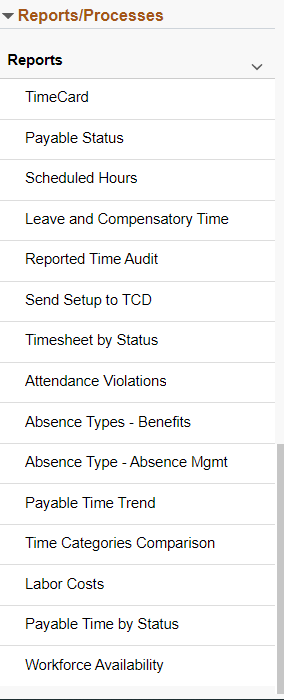
The Reports/Processes group box provides access to the Workforce Availability analytics and reports.
Image: Reports/Processes Group Box
This example illustrates the fields and controls on the Reports/Processes Group Box.