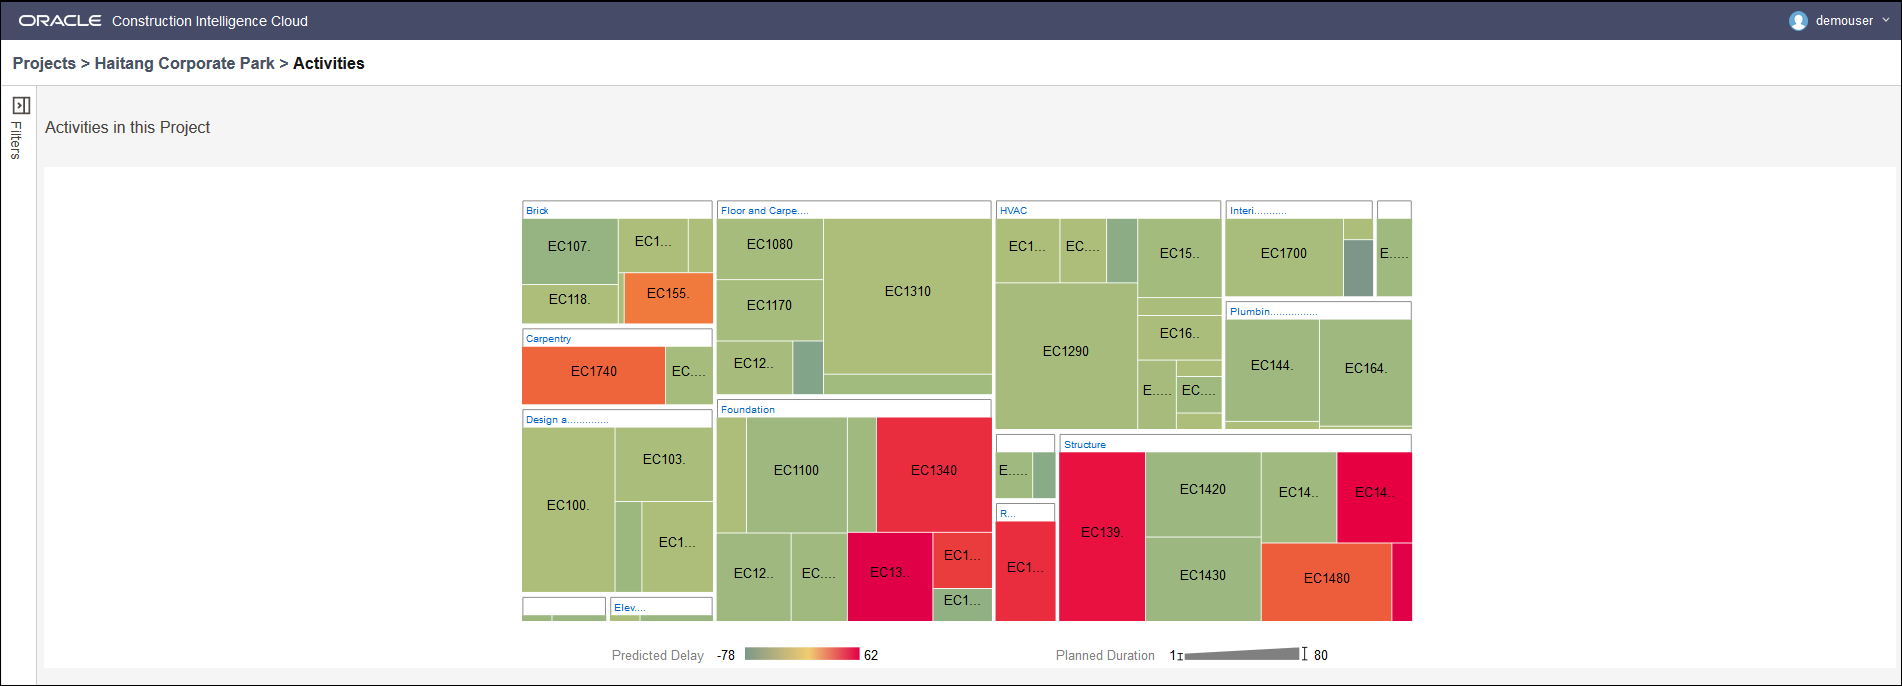
The Activities in this Project section of the Activity Delay Detail page displays an activity heat map of your project. Use this page to determine:
- how any activity on the project fits into the overall schedule and assess the impact of the probable delay associated with that activity
- which activities are causing a delay in the project schedule
For example, an activity with a large duration and delay may not have as much of an impact as an activity on the critical path with a smaller duration and delay.
To view more information from the activity heat map, select any of the following actions:
- hover over a rectangle to view to view the activity details. For example, hover over Activity ID EC1310 to view the Activity Name, Fabricate and Deliver Flooring.
- Click on a rectangle to view activity details.
Note: A heat map is a data visualization technique that represents hierarchical data in a tree-like structure. The heat map provides an overview of all the various activities that are part of various WBSs in a project.
Interpreting the Heat Map
The heat map shows all activities in a project. Each rectangle in the heat map is characterized by two attributes: Dimension and Color.
- Each rectangle represents an activity.
- The dimensions of the rectangle reflects the planned duration of the activity. The larger the rectangle, the longer the planned duration of that activity.
For example, the planned duration of Fabricate and Deliver Flooring activity is 212 days compared to the planned duration of 300 days for the Fabricate and Deliver Heat Pump and Controls activity (Activity ID EC1290).
- The color of each rectangle indicates the extent of predicted delay. The darker the color, the larger the extent of gain or delay.
Green represents an activity that is predicted to finish ahead of time.
Red represents an activity that is predicted to be delayed.
For example, the predicted delay of Install Ceiling Grid activity (Activity ID EC1740) is 15 days and colored orange compared to the predicted delay of 39 days for Concrete Second Floor activity (Activity ID EC1480) which is colored red. However, the predicted delay for Activity IDs Concrete Foundation Walls activity (Activity ID EC1350) and Concrete Basement Slab activity (Activity ID EC1470) is 62 days and 47 days respectively. Therefore both activities are colored red with the same intensity.
Therefore a large rectangle with a dark color indicates the activity contributed significantly towards the planned duration and predicted delay of the project as shown for the Install Ceiling Grid activity (Activity ID EC1740) in Carpentry.