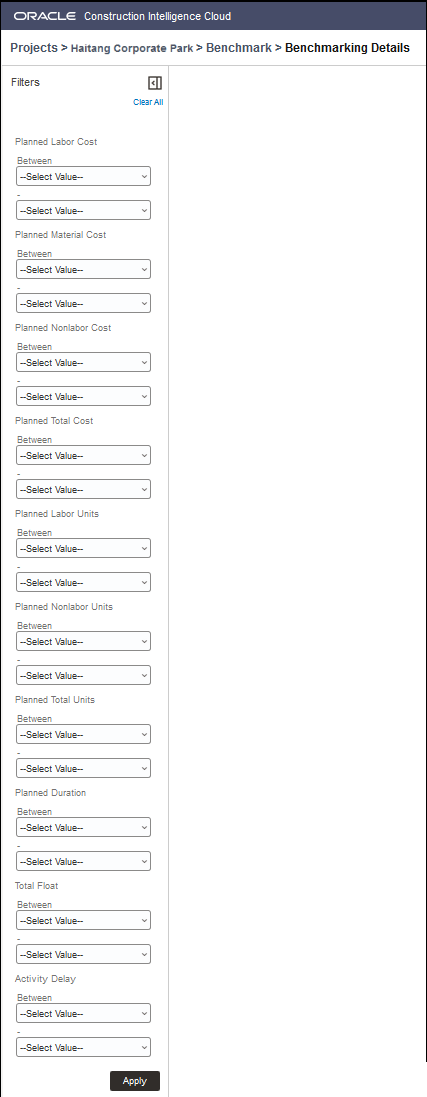
In the sidebar, use the Filters pane to adjust the values of any of the following filters to customize the scatter plot graph and the tabulated information on the Benchmarking Details page.
| Enter or select a range of values for the following filters and then select the Apply button.
Select Clear All to reset all the values in the Filters pane. |
|---|