Litigious Risks in the last Six Months Section
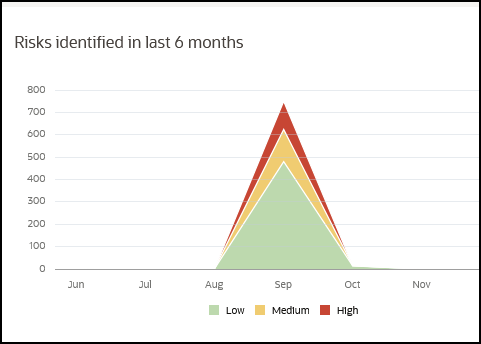
Risks Identified in the last Six Months Graph: Use the line graph to understand how the risks are trending for your project in the past six months. Trend lines for risk are displayed for high (red), medium (amber) and low (green) risks. This information is derived from the mails tracked using Oracle Aconex. The X-axis displays the months, and the Y-axis displays the number of risks identified.
Related Topics
Last Published Tuesday, December 24, 2024