Health and Safety Risk by Totals and Issue Type
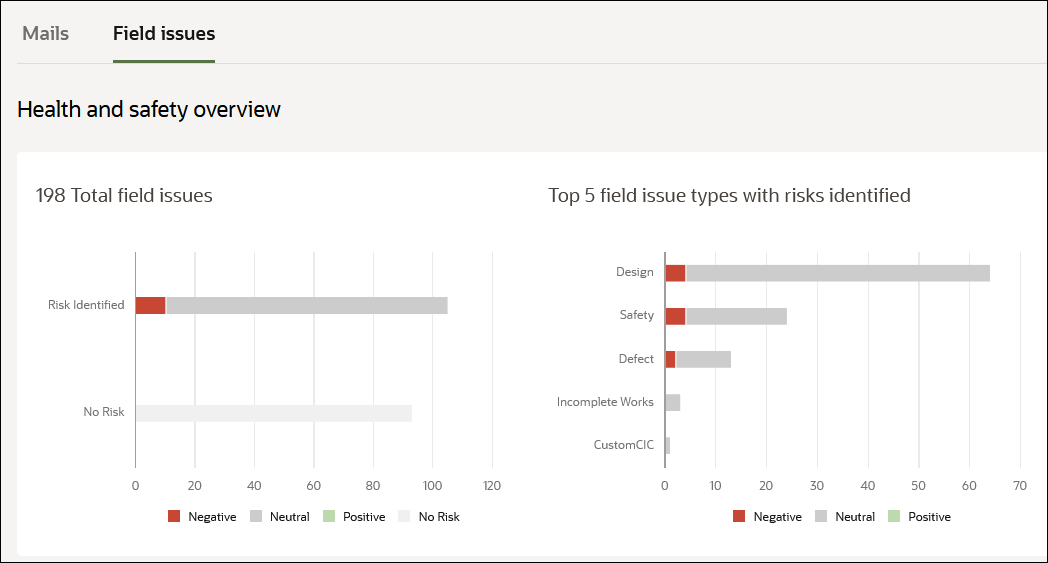
The following bar graphs provide a visual comparison of health and safety risks identified on the field with those without risks:
- The Total field issues bar graph displays the prevalence of potential health and safety risk identified from the field and those without health and safety risks with varying degrees of sentiment (Negative, Neutral, Positive, and High) for your project.
- The Top 5 field issues types with risks identified bar graph compares the number of risks by sentiment identified in the top 5 issue type categories for your project. The graph is sorted in the descending order with the issue type with the largest number of risks on top.
Related Topics
Last Published Tuesday, December 24, 2024