Health and Safety Risk from Field Issues in Last 6 Months
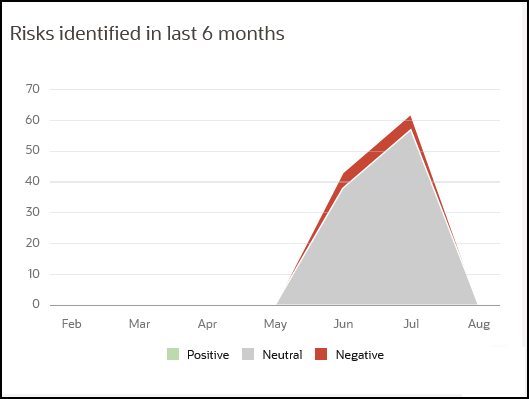
Risks Identified in last 6 Months Graph: Use the line graph to understand the trend in the health and safety risks identified from the Field module of Oracle Aconex during the past six months for your project. Trend lines for risk are displayed based on low (green), neutral (grey), and negative (red) sentiment. The X-axis displays the months in which the health and safety risk occurred, and the Y-axis displays the number of risks.
Related Topics
Last Published Tuesday, December 24, 2024