Change Risks Hostspots
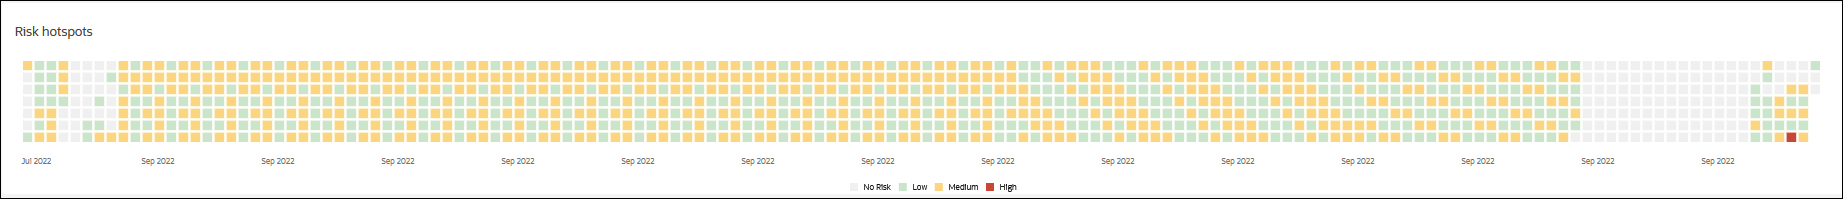
The Risks Hotspots section displays a chart with risks identified over the length of the project to date. Use this chart to identify change risk hotspots in your project. This chart can also be customized using the filter criteria in the Field Issues Filters Pane of the Change Risks Page.
Hover your cursor over a hotspot to view the following details for field issues:
- Date: The date when the field issue was sent to your organization.
- Subject: The subject line of the field issue tracked in th source application.
- Mail Type: The category to which this field issue can be associated.
- Likelihood: The potential of the risk materializing in your project is characterized as either High, Medium, or Low.
Each square represents a mail whose severity is characterized by its color as follows:
- Grey represents mails that do no contain any change risk
- Red represents mails that contain change risk of high severity
- Amber represents mails that contain change risk of medium severity
- Green represents mails that contain change risk of low severity
Related Topics
Last Published Tuesday, December 24, 2024