Activity Details Table
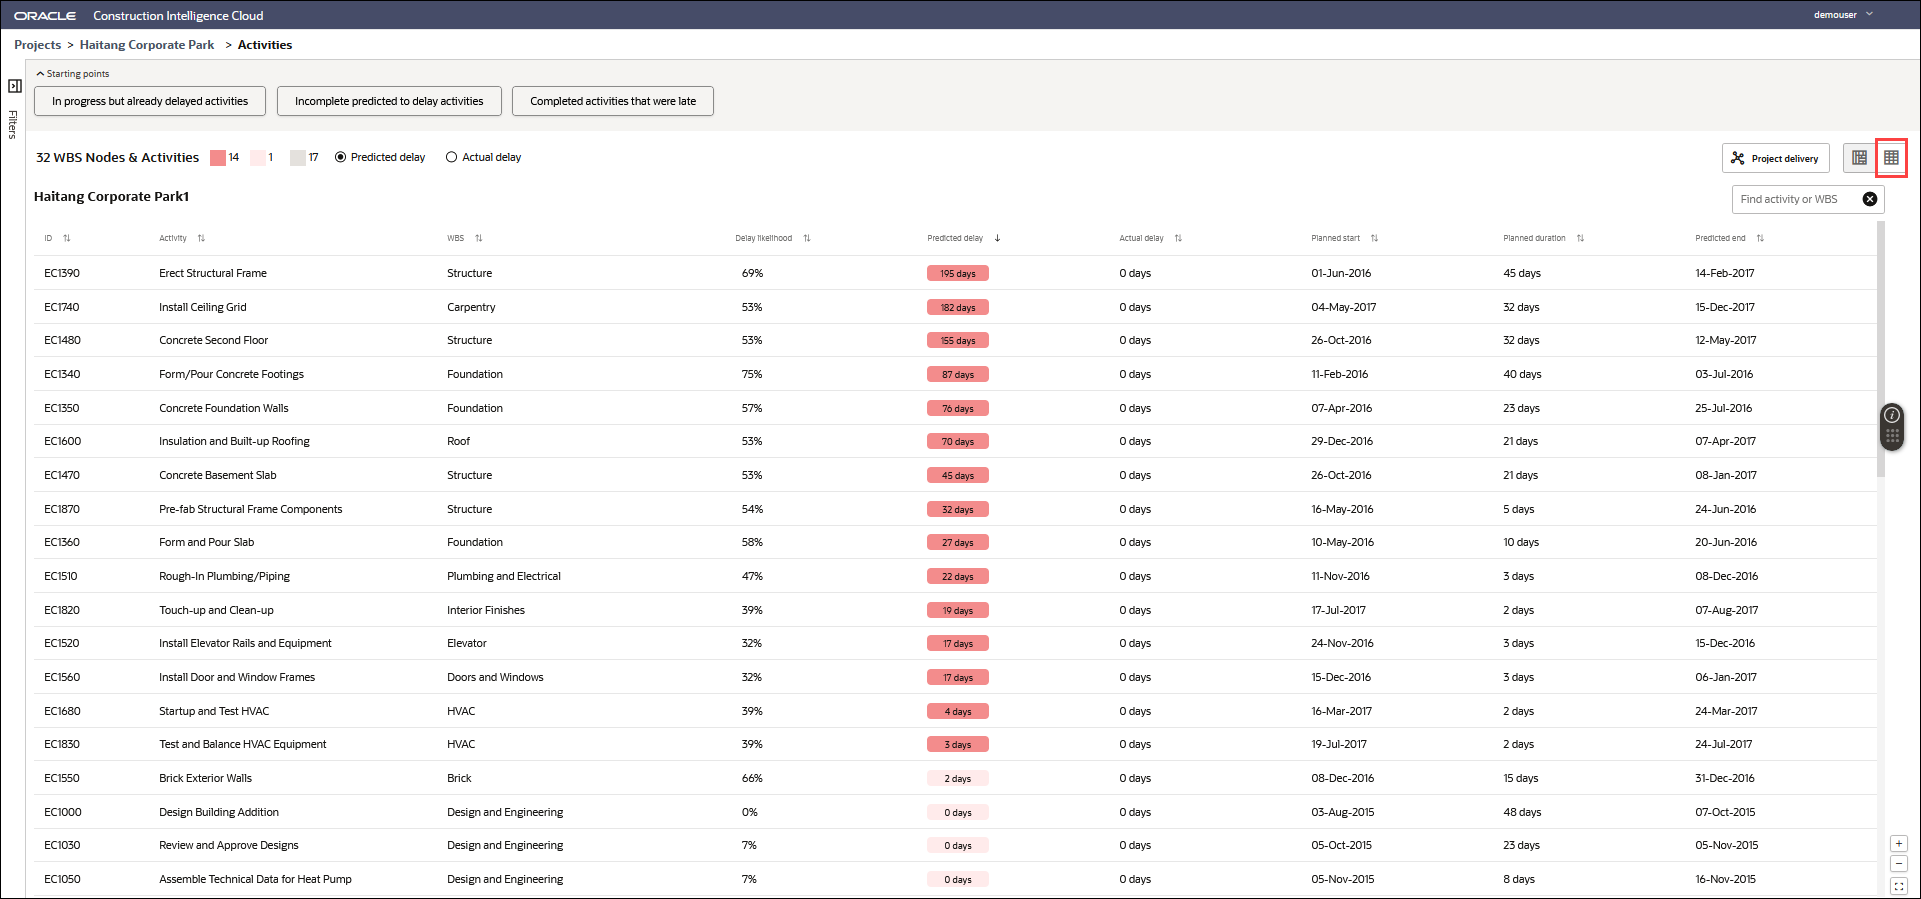
An alternative to the heat map view is the tabular view for reviewing activity details. To view a list of activities, click ![]() Activity List on the Activities page (shown above). Additionally, you can also group the list of activities by WBS, and by Actual Delay or Predicted Delay.
Activity List on the Activities page (shown above). Additionally, you can also group the list of activities by WBS, and by Actual Delay or Predicted Delay.
To focus on specific subset of activities in the table, click on the any of the following buttons:
- In progress, but already delayed activities
- Incomplete predicted to delay activities
- Completed activities that were late
In the WBS Nodes & Activities field, select or deselect the relevant check box to include or exclude those activities and nodes from the heat map and the Activities table. It displays the total number of WBS nodes and activities, and classifies the nodes into the following color-coded categories using their delay metric value:
- Activities and nodes with a high delay impact of being greater then 70 indicated in red
- Activities and nodes with medium delay impact of being between 30 and 70 indicated in pink
- Activities and nodes with low delay impact of less than 30 indicated by grey
- Activities and nodes completed on time is a equal to 0
The delay impact value for each node is calculated as (selected delay type / planned duration) x 100.
The following information is displayed for each activity:
- ID: A unique identifier for each activity.
- Activity: The name of the activity.
- WBS: The Work Breakdown Structure associated with the activity.
- Delay likelihood: The probability of the activity being delayed.
- Predicted delay: The expected delay in completing the activity.
- Actual delay: The difference between the planned start date or planned finish date and the corresponding actual start date or actual finish date of an activity.
- Planned start: The date on which the activity is expected to start. A delayed start or an early start is indicated in parenthesis. For example a 10 day delay is indicated as (+10), and an early start of 5 days is indicated as (-5) days.
- Planned duration: The expected amount of time required to complete an activity.
- Predicted finish: The date on which the activity is expected to complete. A delay or early finish is indicated in parenthesis. For example a 10 day delay is indicated as (+10), and an early finish of 5 days is indicated as (-5) days.
Use this information to identify delayed activities. All predicted information have been generated using models in CIC Advisor.
Related Topics
Last Published Tuesday, December 24, 2024