Using Explain to Discover Data Insights
When you select a column and choose the Explain feature, CIC Analytics uses machine learning to analyze the column in the context of the data set. For example, Explain searches the selected data for key drivers and anomalies.
Note: The Explain feature only works when you use a dataset or create a dataset from a local subject area.
Explain displays its findings to you as text descriptions and visualizations. You can select key visualizations and add them to your workbook's canvas.
If you perform explain on a column and the results contain too many correlated and highly ranked columns (for example, ZIP code with city and state), then excluding some columns from the dataset so that Explain can identify more meaningful drivers. See Hiding or Deleting a Column.
- In the Home page, click Create and then Workbook to create a new workbook.
- Click Visualize.
- In the Data Panel, right-click a column and select Explain <Data Element>.
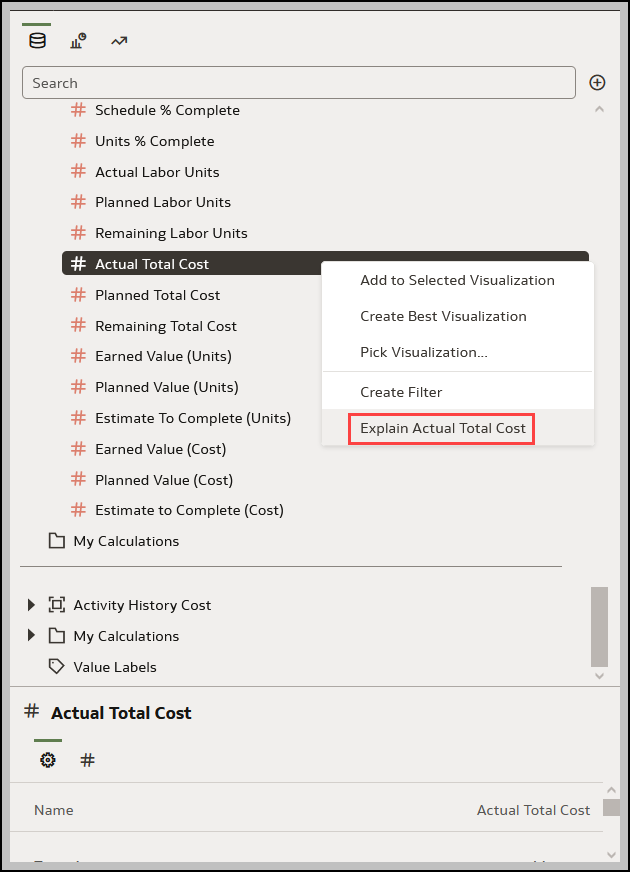
You must have write access to the dataset for the Explain <Data Element> option to display.
For Explain to successfully analyze an attribute, the attribute must have three to 99 distinct values.
The Explain dialog displays basic facts, anomalies, and other information about the selected column.
- Optional: In the Segments view, select the segments (or groups) that predict outcomes for the column you selected.
- Click one or more columns to see how they impacts the column's outcome.
- Sort how the information is displayed in the Segments. For example, confidence high to low or low to high.
- For each visualization that you want to include in your workbook's canvas, hover over it, and click Select for Canvas.
You'll see a green tick next to selected items.
- Click Add Selected.
You can manage the Explain (data insight) visualizations like any other visualizations you’ve manually created on the canvas.
Related Topics
Last Published Friday, December 8, 2023