Accessing Color Options
You can set color options for your workbook and for individual visualizations within your workbook.
- On the Home page, select a workbook, click the Actions menu, and then select Open.
- If you want to edit color options for the whole workbook:
- Click Menu
 on the workbook toolbar and select Workbook Properties.
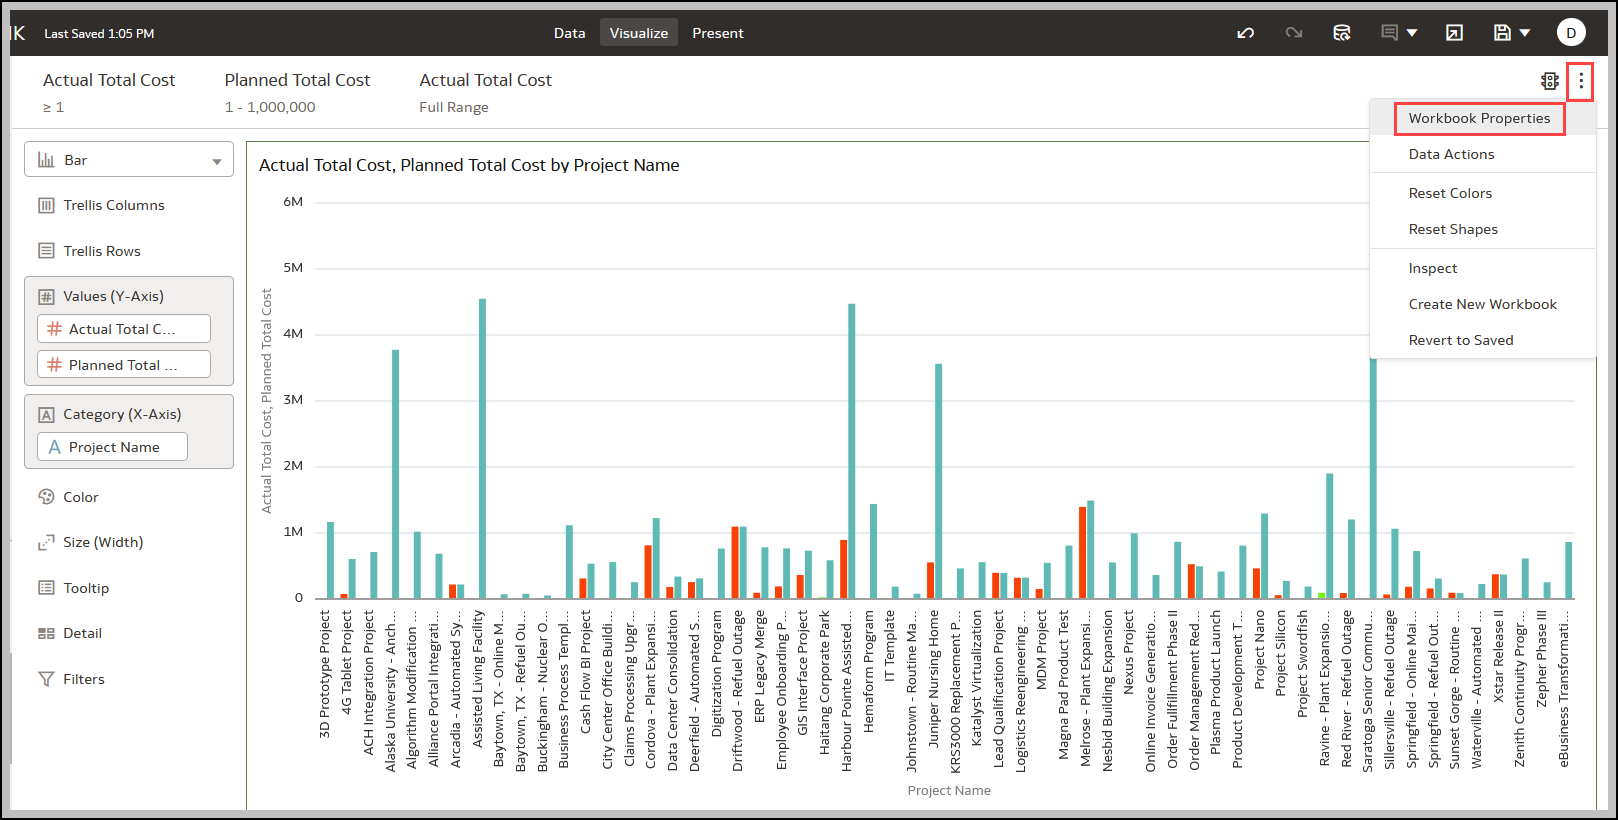
- Edit the Color Series or Continuous Coloring.
- Click Menu
- If you want to edit color options for a visualization:
- Select the visualization and click Menu or right-click.
- Select Color. The available color options depend on how the measures and attributes are set up in your visualization.
- You can experiment with visualization colors and select Reset Visualization Colors to revert to the original colors.
- Select Stretch Palette to turn this option on or off.
Color palettes have a set number of colors, and if your visualization contains more values than the number of color values, then the palette colors are repeated. Use the Stretch Palette option to expand the number of colors in the palette. Stretch coloring adds light and dark shades of the palette colors to give each value a unique color. For some visualizations, stretch coloring is used by default.
- Select the visualization and click Menu
Related Topics
Last Published Friday, December 8, 2023