Viewing Workforce Composition Insights
Administrators can use the Workforce Composition dashboard to evaluate employee counts within their organization. Based on user privileges and criteria, such as date range, departments, and full- or part-time status, administrators can analyze their employee workforce numbers, or a subset, that have been updated within the date range specified.
The Workforce Composition dashboard is built on the PeopleSoft Insights platform, which relies on an underlying analytics engine and search engine. Workforce Composition data that is visible on the dashboard comes from the Person Global Search index HC_HR_PERSON.
This topic provides an overview of how to set up the Insights Dashboard for Workforce Composition analytics and discusses the PeopleSoft Insights Dashboards for Workforce Composition.
Understanding PeopleSoft Insights
PeopleSoft Insights is an analytical engine that provides visual reports (visualizations) in the form of charts, tables, graphs and so on. The visualizations are based on queries that retrieve data from the PeopleSoft Search Framework.
These videos provide an overview of the PeopleSoft Insights feature:
Video: Insights with PeopleSoft
Video: PeopleSoft HCM Insights
For information on Insights dashboards, see:
PeopleTools Search Technology: “Monitoring PeopleSoft Search Framework and OpenSearch” and “Working with Insights Dashboards for PeopleSoft Application Data” documentation
|
Page Name |
Definition Name |
Usage |
|---|---|---|
|
HC_WORKFORCE_COMP_FL (this is the cref for the tile) |
Access Insights visualizations related to employee number counts that have experienced person data changes over a period of time. The data represented is based on your row level security. |
|
|
HC_WORKFORCE_COMP_FL (this is the cref for the dashboard) KIBANA_COMP (this is the cref for the dashboard) PTSF_KIBANA_COMP |
Review Insights visualizations related to number counts for employees that have experienced person data changes during a specified period. The data represented is based on your row level security. |
Before administrators can access the visualizations for Workforce Composition data, the following steps should be performed:
Deploy the HC_HR_PERSON (Person) index.
()
Build the HC_HR_PERSON search index.
()
Deploy the Workforce Composition Tile and Workforce Composition dashboard.
()
Note: The full index must be run before the dashboard can be deployed
Assign the Workforce Composition Admin role to users that should be granted access to view the Workforce Composition dashboard.
Use the Workforce Composition tile to access Insights visualizations related to employee number counts that have experienced person data changes over a period of time. The data represented is based on your row level security.
Navigation:
From the Workforce Administrator home page, click the Workforce Insight Tile. The Workforce Composition tile is located on the Workforce Insight Dashboard.
This example illustrates the Workforce Composition tile.
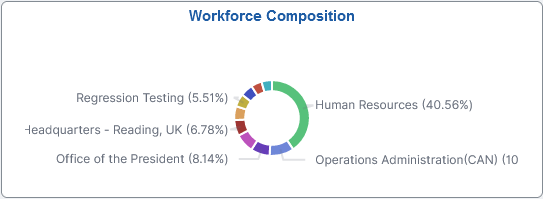
The tile displays the Employee by Department donut visual by default. Select the tile to access the Workforce Composition Dashboard.
Use the Workforce Composition dashboard to review Insights visualizations related to number counts for employees that have experienced person data changes during a specified period. The data represented is based on your row level security.
Note: This dashboard displays employee number counts for employees with personal data changes during the specified period. Persons of interest and contingent workers are not included in these analytics.
Navigation:
Select the Workforce Composition Tile from the Workforce Insight dashboard.
Note: You must be assigned the Workforce Composition Admin role to view this dashboard.
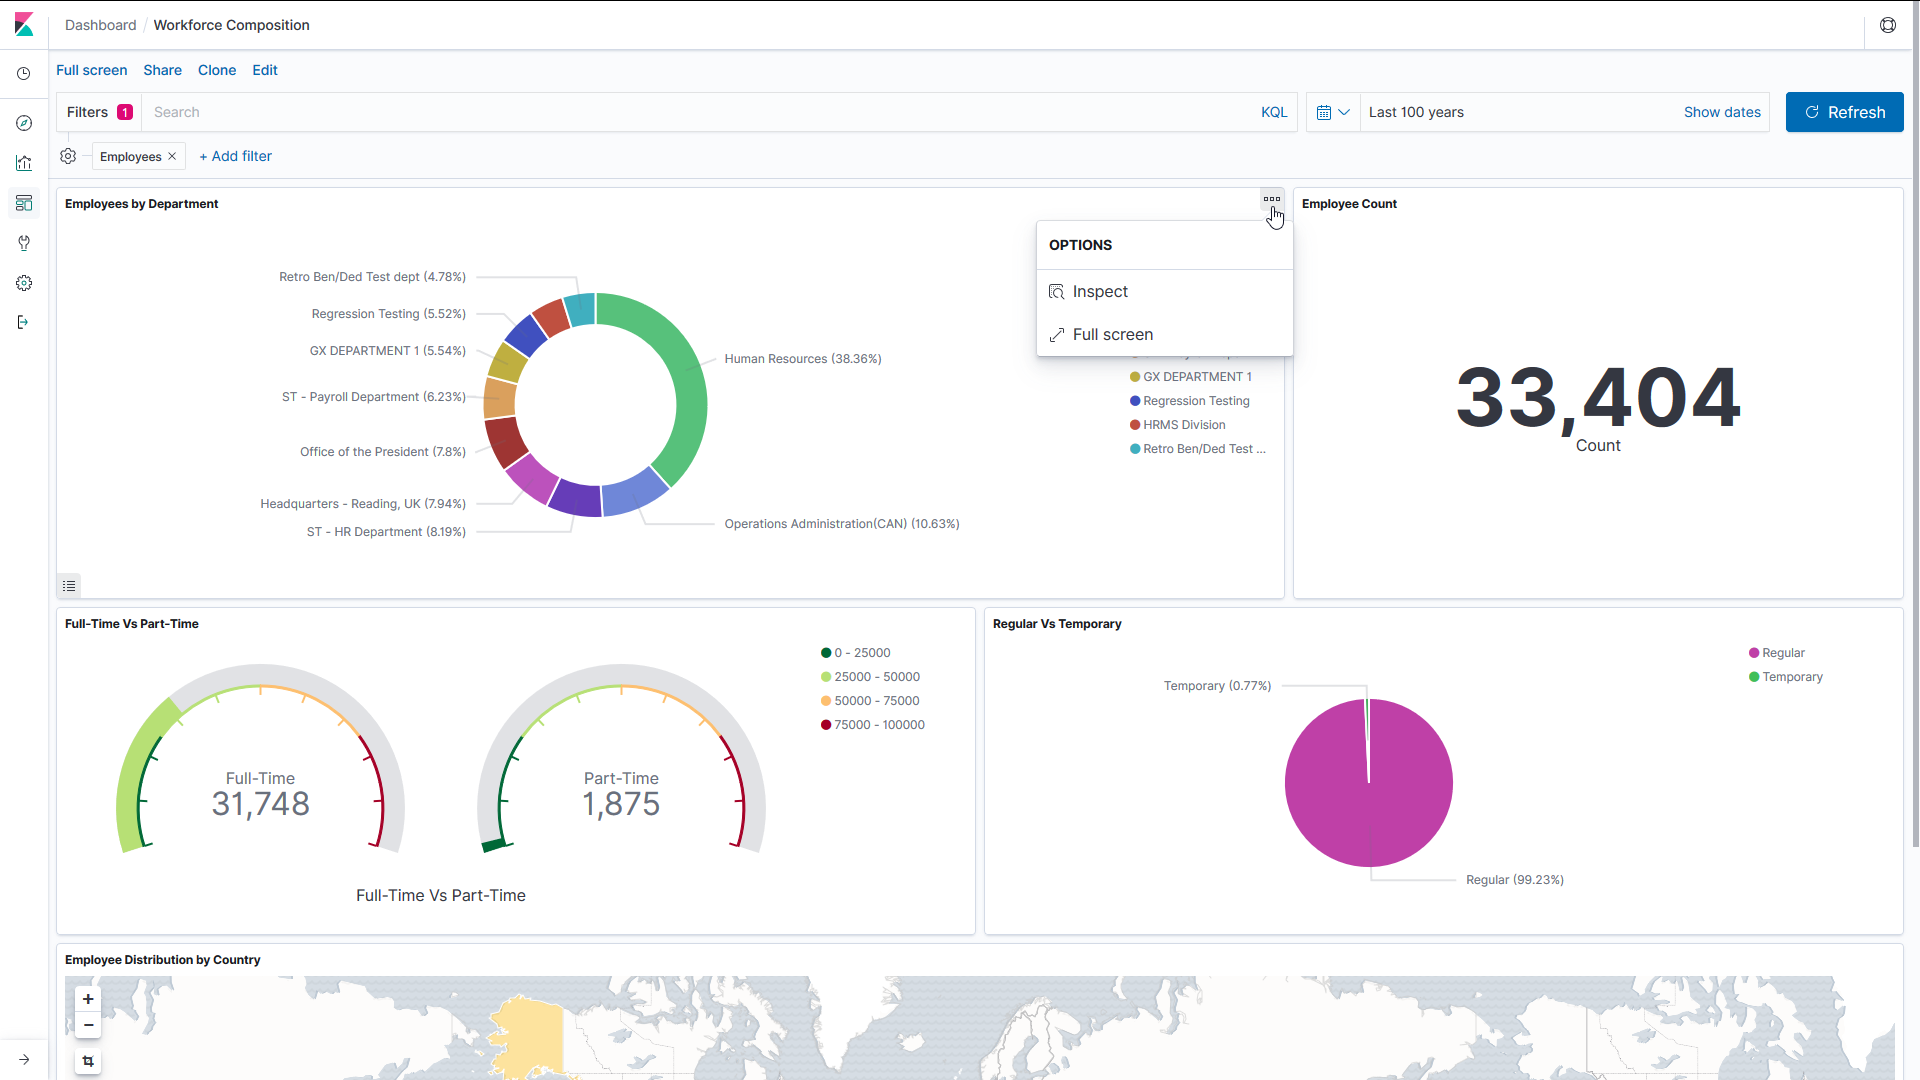
This example illustrates the Workforce Composition dashboard (1 of 2). This screenshot shows one filter in place, which has the visualizations display data for employees only. It also shows the Options and Legend icons that will display when you pause over a visualization.
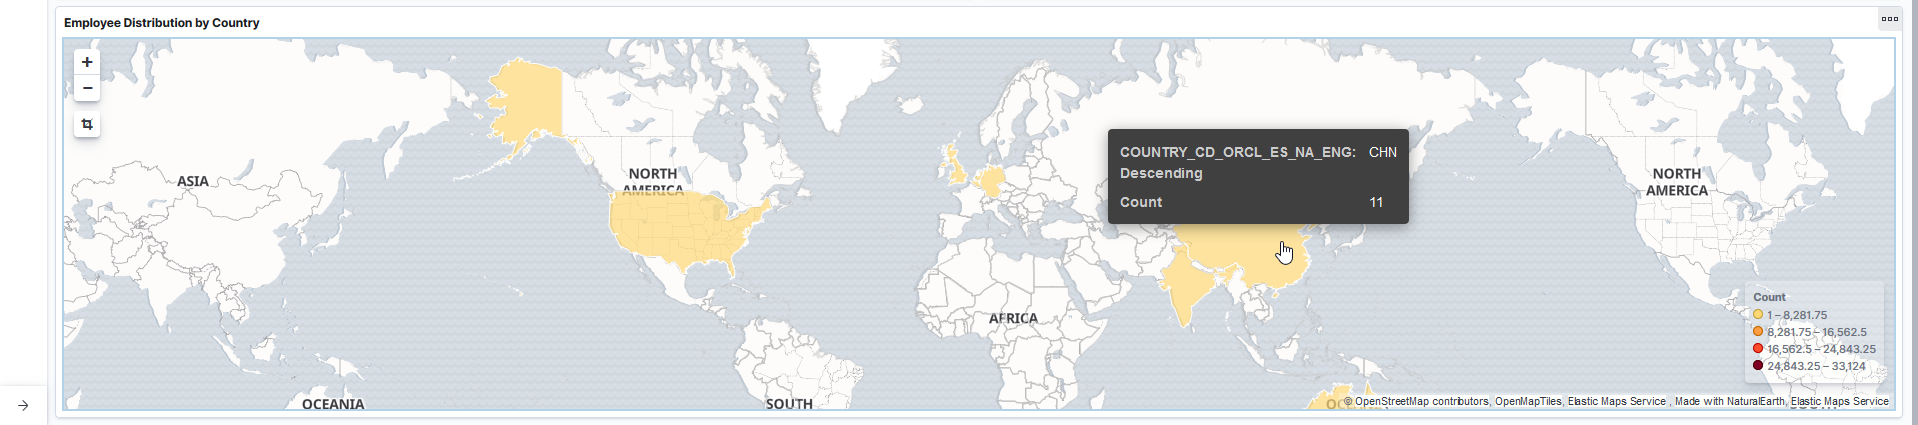
This example illustrates the Workforce Composition dashboard (2 of 2). This screenshot shows the popup menu details that appears when you pause over a chart item.
Warning! PeopleSoft Insights dashboards may not render properly if you access them using unsupported platforms.
The Workforce Composition dashboard provides you with different visualizations to analyze employee composition data modified within a specified time frame. Note that the delivered default time period is set to 15 years, but you can modify this filter at the top of the page. When you select filters or chart items, Insights dynamically updates all visualizations using the sources from the index.
Each visualization enables you to inspect the chart, table or map to view the details of that visualization. Pause over a visualization to have the have additional page elements appear, view numbers, or click items to add filters to your visualizations.
For more information on working with PeopleSoft Insights and filters, see PeopleTools: Search Technology, “Working with Insights Dashboards for PeopleSoft Application Data” documentation.
Delivered Workforce Composition Visualizations
The Workforce Composition dashboard provides this collection of visualizations based on your filter settings, such as date range of person data changes:
|
Visualization |
Description |
|---|---|
|
Employees by Department |
This doughnut visualization displays the top 10 departments based on employee count. It shows the percentage of employees per department in relation to other the departments shown in the chart. Pause over a chart item to view the number of employees in a department that have experienced person data changes within the date range specified. |
|
Employee Count |
This visualization displays a count of employees within the specified parameters. |
|
Full-Time Vs Part-Time |
This visualization displays two gauges: one showing the count of full-time employees, one showing the count of part-time employees. Pause over a gauge bar to view the number of employees in the group. |
|
Regular Vs Temporary |
This pie chart visualization shows the percentage of employees that are regular employees versus those that are temporarily employed. Pause over a pie slice to view the number of employees in the group. |
|
Employee Distribution by Country |
This map visualization displays a map of where employees are located world-wide. |