Analyzing Expenses Using PeopleSoft Insights
This topic displays and explains how to analyze Expense data using PeopleSoft Insights dashboards.
Use these pages to analyze Expenses using PeopleSoft Insights dashboards.
|
Page Name |
Definition Name |
Usage |
|---|---|---|
|
View the top employees who have violated expense policy |
||
|
View expense reports that you have prepared. This includes your own expense reports and those where you have created an expense report on behalf of someone else. |
||
|
Analyze the activity in a department or business unit for compliance with travel and expense policies. |
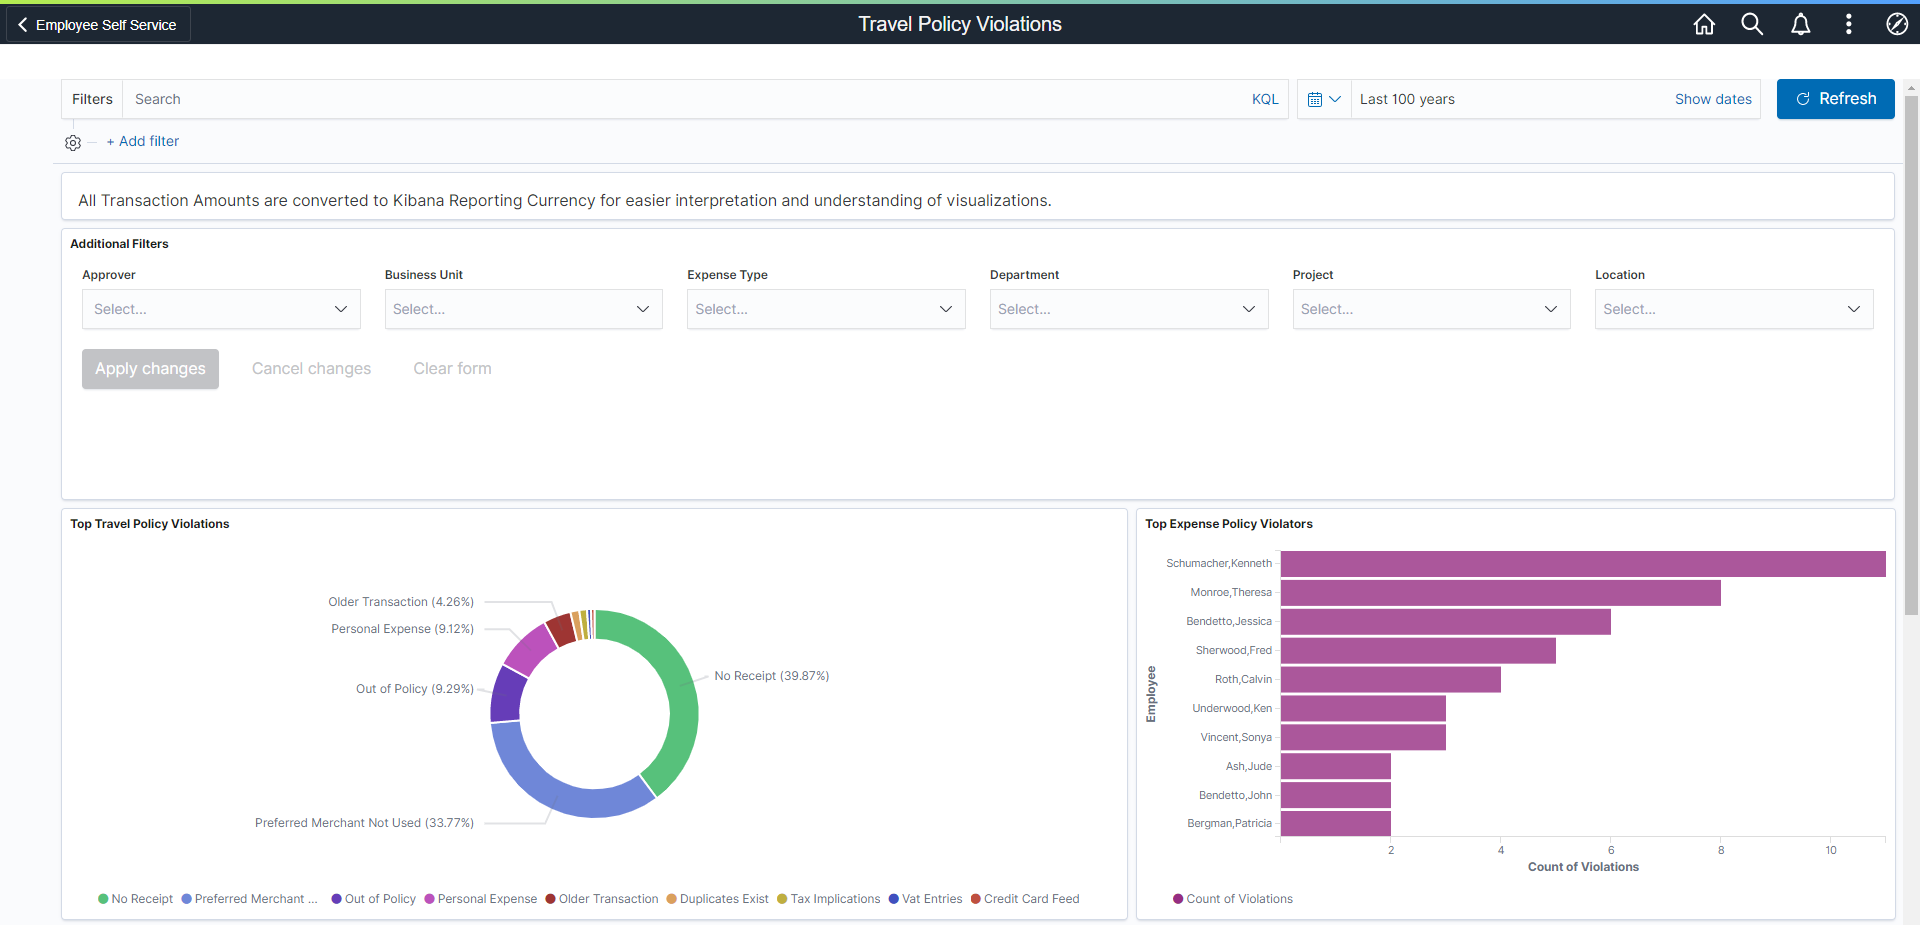
Use the Travel Policy Violations dashboard to view the top employees who have violated expense policy.
Navigation:
Select the Travel Policy Violations tile.
This example illustrates the fields and controls on the Travel Policy Violations Dashboard (1 of 2).
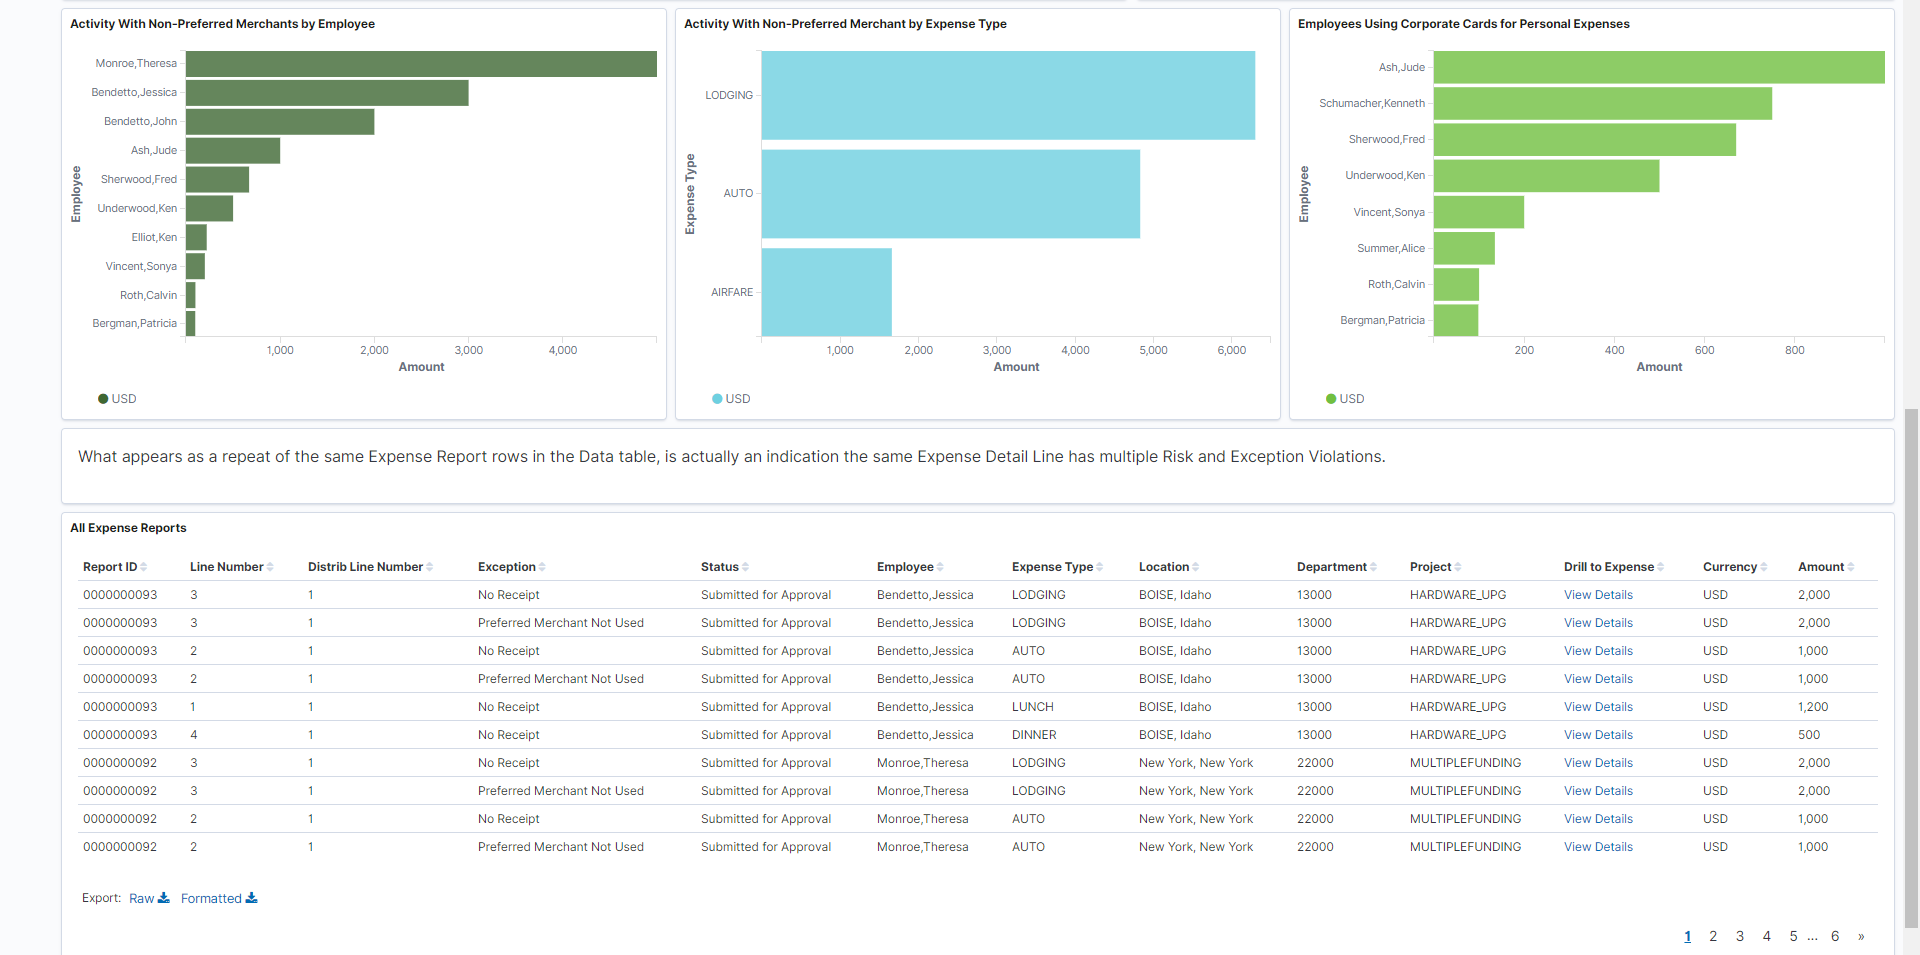
This example illustrates the fields and controls on the Travel Policy Violations Dashboard (2 of 2).
Note: All transaction amounts are converted to the dashboard reporting currency for easier interpretation and understanding of visualizations. The dashboard reporting currency is configured on the Installation Options - Expenses Page.
Violation counts are determined at the line level, not by expense report. Therefore, you can have three line level violations for the same expense report.
Each bar chart displays the top 10 violators. If there are only 4 violations, then only 4 are displayed.
All Expense Reports
This grid displays all expense reports included in the filtered violations.
Rows that appear as a repeat of the same expense report in the table indicates that the same expense detail line has multiple risk and exception violations.
|
Field or Control |
Description |
|---|---|
|
View Details |
Select to access the Expense Report Page. |
Use the My Travel Policy Violations dashboard to view expense reports that you have prepared. This includes expense reports for yourself and those you have prepared on behalf of someone else.
This example illustrates the fields and controls on the My Proxy Expense Activity dashboard (1 of 2).

This example illustrates the fields and controls on the My Proxy Expense Activity dashboard (2 of 2).

Use Prepared For to select an individual for which you prepare expense reports.
The All Expense Reports grid displays violations included in the visual graphs above. Select View Details to access the expense report.
Use the Performance & Operations dashboard to analyze the activity in a department or business unit, for compliance with travel and expense policies. Managers determine if remediation actions such as a review or refresh of travel policies or additional training for employees is needed.
This example illustrates the fields and controls on the Performance & Operations dashboard (1 of 3).

This example illustrates the fields and controls on the Performance & Operations dashboard (2 of 3).

This example illustrates the fields and controls on the Performance & Operations dashboard (2 of 3).

The Average Days from Submission to Approval and the Average Days from Approval to Payment numbers allow you to determine whether there are bottlenecks in your entire business process. If these numbers are higher than expected, then you can investigate.