Using OTAs for PeopleSoft Program Management
This topic discusses OTAs in PeopleSoft Program Management.
|
Page Name |
Definition Name |
Usage |
|---|---|---|
|
Personalize Operational Threshold Alerts Page |
PC_PE_OTA_PRS |
Select the OTAs to display on the Operational Threshold Alert or Operational Threshold Chart pagelets. Access the page used to personalize individual OTA tolerance levels. See the Personalize Operational Threshold Alerts Page for more information. |
|
Operational Threshold Alert Pagelet |
PC_PE_OTA_LIST (wide) PC_PE_OTA_LIST_N (narrow) |
View up to five OTAs that display real-time monitoring data according to tolerance levels that you define. See the Operational Threshold Alert Pagelet for more information. |
|
Operational Threshold Chart Pagelet |
PC_PE_OTA_CHART |
View an OTA that displays a real-time monitoring chart according to tolerance levels that you define. See the Operational Threshold Chart Pagelet for more information. |
|
PC_PE_BETV_PRS
|
Define default data for calculating and displaying the Budget to Forecast Time Variance OTA. |
|
|
PC_PE_PJLT_PRS |
Define default data for calculating and displaying the Projects Predicted to be Late OTA. |
|
|
RS_PE_RSAU_PRS |
Specify the business unit, date range, filter, and alert variance threshold percentage for the Actual to Forecast Utilization analysis. |
|
|
RS_PE_RSFU_PRS |
Specify the business unit, date range, filter, and alert threshold percentage for the Forecast Utilization OTA. |
An OTA must be selected on the Personalize Operational Threshold Alerts page for it to appear on a pagelet. OTAs are viewed on the Operational Threshold Alert pagelet with data that is personalized at the system administrator level or by the user. Two of the PeopleSoft Program Management OTAs—Forecast Utilization and Actual to Forecast Utilization—can also be viewed on the Operational Threshold Chart pagelet.
This section discusses calculations for these OTAs:
Budget to Forecast Time Variance
Projects Predicted Late to be Late
Forecast Utilization
Actual to Forecast Utilization
Calculating Budget to Forecast Time Variance
The calculations for the Budget to Forecast Time Variance OTA are:
|
Variable |
Calculation Method |
|---|---|
|
Budget Hours |
Sum of the values in the Project Summary table RESOURCE_QUANTITY field for rows belonging to the Projects Budget analysis group. |
|
Estimated Remaining Hours |
Sum of the values from the Forecasting Detail table (TOTAL_HOURS + REMAINING_HRS) for rows in the most current forecast horizon. |
|
Actual Hours |
Sum of the values in the Project Summary table RESOURCE_QUANTITY field for rows belonging to the Projects Cost analysis group. |
|
Estimated Hours |
Estimated Remaining Hours + Actual Hours |
|
Percent Variance |
((Estimated Hours – Budget Hours) / Budget Hours) x 100 |
For this OTA, the unit of measure is converted to hours, or the row is excluded from the calculation if the unit of measure cannot be converted to hours.
Calculating Projects Predicted to be Late
The calculation for the Projects Predicted to be Late OTA is:
|
Variable |
Calculation Method |
|---|---|
|
Project Estimated Completion Date |
The maximum COMPLETION_DATE on the Forecasting Detail table for the most current forecast horizon for each project. |
|
Number of Projects Predicted to be Late |
Count of the projects where the Estimated Completion Date is less than the value in the Project End Date field on the Project table. |
Calculating Actual to Forecast Utilization
The Actual to Forecast Utilization OTA compares actual utilization with forecasted utilization for a specified group of resources and period of time. This table lists the calculations for the Actual to Forecast Utilization OTA:
|
Variable |
Calculation Method |
|---|---|
|
Actual Utilization |
A percentage equal to the actual resource hours entered, that are not denied, in PeopleSoft Expenses for the specified period of time, divided by resource capacity for that period of time. |
|
Forecast Utilization |
A percentage equal to the forecasted resource utilized hours for the specified period of time entered in Services Forecasting divided by the resource capacity for that period of time. |
|
Actual to Forecast Utilization Variance |
The actual utilization percentage minus the forecast utilization percentage. The system compares the absolute value of the variance to the alert variance threshold percentage value that is specified by an administrator or personalized by each user. If the variance is less than or equal to the alert variance threshold percentage, a green visual indicator appears on the OTA pagelet. If the variance exceeds the alert variance threshold percentage, a red alert visual indicator appears on the OTA pagelet. For example, if actual utilization is 70% and forecast utilization is 85%, the variance is –15%. If the alert variance threshold percentage value is 10%, a red alert visual indicator appears because the absolute value of the variance is greater than the alert variance threshold. |
You can click Actual to Forecast Utilization in the Operational Threshold Alert pagelet to access the Utilization Parameters - Business Units or Organizational Units page in the PeopleSoft Program Management Services Forecasting feature to launch a resource utilization interactive report. You can filter the report by HR business unit, department, location, job code, employee ID, and range of weeks to include in the report.
Calculating Forecast Utilization
The Forecast Utilization OTA compares forecasted utilization with capacity for a specified group of resources and period of time. This table lists the calculations for the Forecast Utilization OTA:
|
Variable |
Calculation Method |
|---|---|
|
Forecasted Hours |
The estimated total number of project and personal hours for the specified period of time that are entered in Services Forecasting that a resource plans to engage in activity that the organization treats as utilized time. |
|
Capacity Hours |
The standard hours less company holiday hours for the resources that are included in the utilization analysis. |
|
Forecast Utilization |
The total number of hours that a resource plans to engage in activity that the organization treats as utilized time divided by the resource's capacity for a given period of time. This percentage is the total forecasted utilized hours divided by the number of capacity hours in the same period. |
The system compares the forecast utilization percentage to the alert threshold percent value that is specified by an administrator or personalized by each user. If the forecast utilization equals or exceeds the alert threshold, a green visual indicator appears on the OTA pagelet. If the forecast utilization is below the alert threshold, a red alert visual indicator appears on the OTA pagelet.
Each user can determine the scope of the Forecast Utilization OTA by adjusting the OTA's personalization settings. The OTA allows for filtering resources by requiring the user to select a human resources (HR) business unit and the number of future weeks over which the analysis is to take place. The user has the option of further filtering the scope of the analysis by specifying one or more locations or one or more departments within the HR business unit.
Click Forecast Utilization in the Operational Threshold Alert pagelet to access the Utilization Parameters - Business Units or Organizational Units page in the PeopleSoft Program Management Services Forecasting feature to launch a resource utilization interactive report. You can filter the interactive report by HR business unit, department, location, job code, employee ID, and range of weeks to include in the report.
Note: Time reporting codes that qualify as utilized time are specified in the Utilization Definition component (RS_AGG_DEF) in PeopleSoft Program Management.
Use the Personalize Budget to Forecast Time Variance page (PC_PE_BETV_PRS) to define default data for calculating and displaying the Budget to Forecast Time Variance OTA.
Navigation:
Click the Budget to Forecast Time Variance link on the ESA Portal Pack Pagelet Default Administration page.
Click the Personalize icon for this OTA on the Personalize Operational Threshold Alerts page.
This example illustrates the fields and controls on the Personalize Budget to Forecast Time Variance page.

Define the parameters for calculating and displaying the variance between budgets and forecasted time.
Use the Personalize Projects Predicted to be Late page (PC_PE_PJLT_PRS) to define default data for calculating and displaying the Projects Predicted to be Late OTA.
Navigation:
Click the Projects Predicted to be Late link on the ESA Portal Pack Pagelet Default Administration page.
Click the Personalize icon for this OTA on the Personalize Operational Threshold Alerts page.
This example illustrates the fields and controls on the Personalize Projects Predicted to be Late page.
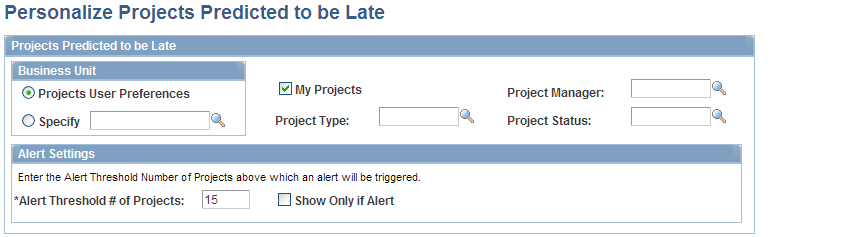
Define the parameters for calculating and displaying the projects that are predicted to be late.
Use the Personalize Actual to Forecast Utilization page (RS_PE_RSAU_PRS) to specify the business unit, date range, filter, and alert variance threshold percentage for the Actual to Forecast Utilization analysis.
Navigation:
Click Actual to Forecast Utilization on the ESA Portal Pack Pagelet Default Administration page.
Click the Customize icon on the Operational Threshold Alert pagelet or Operational Threshold Chart pagelet.
Click the Personalize icon on the Actual to Forecast Utilization line on the Personalize Operational Threshold Alerts page.
This example illustrates the fields and controls on the Personalize Actual to Forecast Utilization page. You can find definitions for the fields and controls later on this page.

You specify business unit, department, and location information in this page in the same way as the Personalize Forecast Utilization page.
Field or Control |
Description |
|---|---|
Number of Past Weeks |
Specify the number of past weeks to analyze. The system starts from the previous week and counts back for the specified number of weeks. Utilization is calculated for the entire number of weeks as if it were one rolling period. Note: The Actual to Forecast Utilization OTA pagelet and chart does not include the current calendar week in the analysis. The most recent calendar week (prior to the current week) counts as 01. The maximum number of weeks that can appear on the OTA chart is five weeks. |
Alert Variance Threshold Percentage |
Enter the actual to forecast utilization variance percentage that triggers an alert on the OTA pagelet. The variance is the absolute value of the actual utilization percentage minus the forecast utilization percentage. If the variance is less than or equal to the value that you enter, a green visual indicator appears on the OTA pagelet. If the variance exceeds the value that you enter, a red alert visual indicator appears on the OTA pagelet. Enter the percentage as a whole or mixed number, such as 10 for 10 percent, or 15.5 for 15.5 percent. Enter a positive number. |
Use the Personalize Forecast Utilization page (RS_PE_RSFU_PRS) to specify the business unit, date range, filter, and alert threshold percentage for the Forecast Utilization OTA.
Navigation:
Click Forecast Utilization on the ESA Portal Pack Pagelet Default Administration page.
Click the Customize icon on the Operational Threshold Alert pagelet or Operational Threshold Chart pagelet.
Click the Personalize icon on the Forecast Utilization row on the Personalize Operational Threshold Alerts page.
This example illustrates the fields and controls on the Personalize Forecast Utilization page. You can find definitions for the fields and controls later on this page.
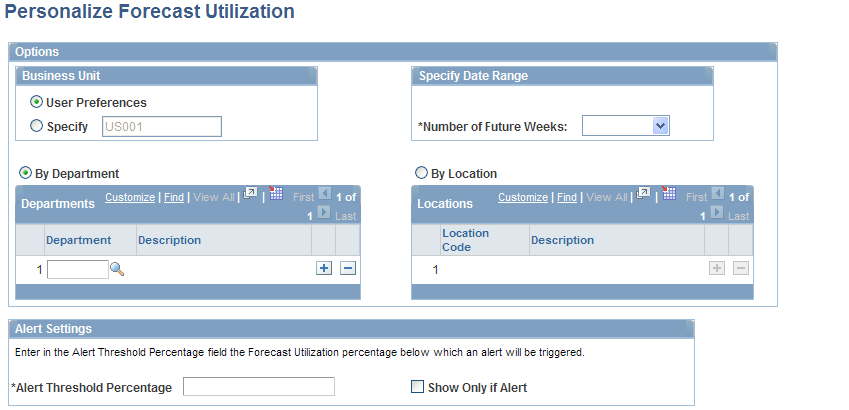
Administrators establish default values for the Forecast Utilization OTA pagelet and chart for each business unit. Users can overwrite the business unit default values when they personalize the Forecast Utilization OTA.
You must select an HR business unit to identify the resources to evaluate in the OTA pagelet or chart. You can view resources from your HR business unit, or select a different business unit. You can also narrow the list of resources to evaluate based on department or location. If you do not specify a department or location, the system evaluates all resources based on the utilization definition of the business unit that you select.
Field or Control |
Description |
|---|---|
User Preferences |
Select to analyze resources from your HR business unit based on the utilization definition. Note: You define the billing actions, time reporting codes, and job codes that constitute utilized time for each HR business unit in the Utilization Definition component in PeopleSoft Program Management. |
Specify |
Select Specify and enter an HR business unit to analyze resources from a business unit other than the HR business unit that is defined in the utilization definition. |
Number of Future Weeks |
Select the period over which utilization is analyzed. The system starts with the current week and counts forward for the specified number of weeks. Utilization is calculated for the entire number of weeks as if it were one rolling period. Note: For the Forecast Utilization OTA, the current calendar week counts as week 01. The maximum number of weeks that can appear on the OTA chart is five weeks. |
By Department |
Select By Department to analyze utilization for one department or multiple departments in aggregate. Click Look up Department to choose from a list of departments. Add as many departments as required. The default value for administrators is the administrator's department and business unit from the Job record (JOB). The default value for individual users is specified by the administrator. |
By Location |
Select By Location to analyze utilization for one location or multiple locations in aggregate. Click Look up Location Code to choose from a list of locations. Add as many locations as required. The default value for administrators is the administrator's location and business unit from the Job record. The default value for individual users is specified by the administrator. |
Alert Threshold Percentage |
Enter the minimum acceptable forecast utilization percentage. If forecast utilization falls below the alert threshold percentage, a red alert visual indicator appears in the OTA pagelet. If forecast utilization equals or exceeds the alert threshold percentage, a green visual indicator appears in the OTA pagelet indicating that the forecast utilization is acceptable. Enter the percentage as a whole or mixed number, such as 85 for 85 percent, or 75.5 for 75.5 percent. Enter a positive number. |
Show Only if Alert |
Select for the OTA to appear on the pagelet or chart only if forecast utilization falls below the alert threshold percentage. Deselect this option for the OTA to appear on the pagelet or chart if forecast utilization falls above, equals, or falls below the alert threshold percentage. |
Restore Defaults |
Select to restore the values on this page to the global default values that are established by the administrator. This button does not appear for administrators who access the page through the Set Up Financials/Supply Chain folder in the menu navigation. |