Viewing OTAs
This topic discusses how to set up and personalize OTAs, and use the Operational Threshold Alert and Chart pagelets.
|
Page Name |
Definition Name |
Usage |
|---|---|---|
|
PC_PE_OTA_LIST |
View up to five OTAs that display real-time monitoring data based on tolerance levels that you define. |
|
|
PC_PE_OTA_CHART |
View an OTA in a chart format that monitors data based on tolerance levels that you define. |
|
|
PC_PE_OTA_PRS |
Select the OTAs to appear on the Operational Threshold Alert or Operational Threshold Chart pagelets. Access the page to personalize individual OTA tolerance levels. |
OTAs display data that identifies and monitors real-time information based on tolerance levels that you define. Specific setup information for each OTA is available in the topics that discuss portal pagelets for each enabling application. For example, the enabling application for the Contract Sales OTA is PeopleSoft Contracts, so you can find the necessary setup information in the topic Using OTAs for PeopleSoft Contracts.
The overall tasks to set up OTAs are:
Define default filter values at the system level for each OTA by accessing the OTA's personalization page from the ESA Portal Pack Pagelet Default Administration page.
Select Operational Threshold Alert on the Personalize Content page and return to the PeopleSoft homepage.
Click the Customize Operational Threshold Alert icon on the Operational Threshold Alert pagelet to access the Personalize Operational Threshold Alerts page and select up to five OTAs that you want to appear on the Operational Threshold Alert pagelet.
You can also select one OTA to appear on the Operational Threshold Chart pagelet.
Use the Operational Threshold Alert pagelet (PC_PE_OTA_LIST) to view up to five OTAs that display real-time monitoring data based on tolerance levels that you define.
Navigation:
Click the Personalize Content link on the PeopleSoft homepage.
Select Operational Threshold Alert on the Personalize Content page and return to the PeopleSoft homepage.
View a list of up to five OTAs that are selected on the Personalize Operational Threshold Alerts page. The data that appears is based on the tolerance level parameters that you set up on each OTA's personalization page.
Field or Control |
Description |
|---|---|
Threshold Alert |
Displays the title of the OTA that you selected on the Personalize Operational Threshold Alerts page. If the title appears as a link, click the link to access a page in the enabling application that contains further details. |
Target |
The target threshold alert value, expressed as a percentage or as an amount, that is specified in each OTA's personalization settings. When a measurement goes beyond the alert threshold, a red alert visual indicator appears on the Operational Threshold Alert pagelet, which indicates that the measurement is not within an acceptable range. When a measurement has not reached, or is equal to, the alert threshold, a green visual indicator appears on the Operational Threshold Alert pagelet, which indicates that the measurement is within an acceptable range. |
Actual |
Displays a calculated value for the OTA based on the OTA's personalization settings. |
Curr (currency) |
Displays the currency code of the actual amount. |
% Variance or Variance Percentage |
Displays a calculated value based on the formula ((Target - Actual) ÷ Target) × 100. |
Visual Indicators |
Displays a red Alert Status icon or green Within Range icon based on the OTA's variance percentage. |
As of Date |
Displays the date that data was last summarized. The date appears for OTAs that are calculated based on summary data from a batch process. |
|
Click the Customize Operational Threshold Alert icon to access the Personalize Operational Threshold Alerts page to select up to five OTAs to appear on the pagelet. |

If administrators or users do not specify personalization options for an OTA, a message appears on the pagelet for the corresponding OTA. Users can specify that only selected OTAs that are in an alert status appear on the pagelet. If you specify that only OTAs in an alert status appear on the pagelet, and none of the selected OTAs are in an alert status, a message appears indicating that all of the selected OTAs are within acceptable tolerances.
Use the Operational Threshold Chart pagelet (PC_PE_OTA_CHART) to view an OTA in a chart format that monitors data based on tolerance levels that you define.
Navigation:
Click the Personalize Content link on the PeopleSoft homepage.
Select Operational Threshold Chart on the Personalize Content page and return to the PeopleSoft homepage.
You can view a bar chart for an OTA that you select on the Personalize Operational Threshold Alerts page. The data appears in the chart results from the tolerance level parameters that you set up on the individual OTA's personalization page. Only one OTA can appear on the chart pagelet at a time.
If an administrator or user do not specify personalization options for the OTA, a message appears on the chart pagelet.
Click the Customize Operational Threshold Chart icon to access the Personalize Operational Threshold Alerts page to select an OTA to appear on the chart pagelet.
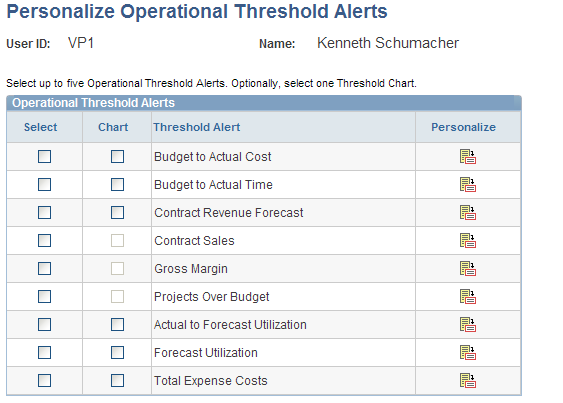
Use the Personalize Operational Threshold Alerts page (PC_PE_OTA_PRS) to select the OTAs to appear on the Operational Threshold Alert or Operational Threshold Chart pagelets.
Access the page to personalize individual OTA tolerance levels.
Navigation:
Click the Customize Operational Threshold Alert icon on the Operational Threshold Alert pagelet.
Click the Customize Operational Threshold Chart icon on the Operational Threshold Chart pagelet.
This example illustrates the fields and controls on the Personalize Operational Threshold Alerts page. You can find definitions for the fields and controls later on this page.
Field or Control |
Description |
|---|---|
Select |
Select up to five OTAs that you want to appear on the Operational Threshold Alert pagelet. |
Chart |
Select one OTA to appear on the Operational Threshold Chart pagelet. |
|
Click the Personalize icon to access the corresponding OTA's personalization page, where you can specify the tolerance level parameters for the OTA. |
