Analyzing Project Costing Information Using Insights Dashboards
This topic displays and explains how to analyze Project Costing Information using Insights dashboards.
Use these pages to analyze Project Costing Information using Insights dashboards.
|
Page Name |
Definition Name |
Usage |
|---|---|---|
|
Analyze a comparison of Actual Cost and Budgeted Cost. |
||
|
Analyze a comparison of Billing, Actual Cost, and Budgeted Cost. |
||
|
Analyze a comparison of Revenue, Billing, Actual Cost, Budgeted Cost, and Profit. |
||
|
Analyze Billing, Actual Cost, Revenue, and Profit for current and previous two years. |
Use the Project Cost Analytics dashboard to analyze a comparison of Actual Cost and Budgeted Cost. This includes analytics by project, manager, vendor/supplier, employee, source type, and project type.
Navigation:
Select the Project Cost Analytics tile.
This example illustrates the fields and controls on the Project Cost Analytics Dashboard (1 of 2). You can find definitions for the fields and controls later on this page.

This example illustrates the fields and controls on the Project Cost Analytics Dashboard (2 of 2).
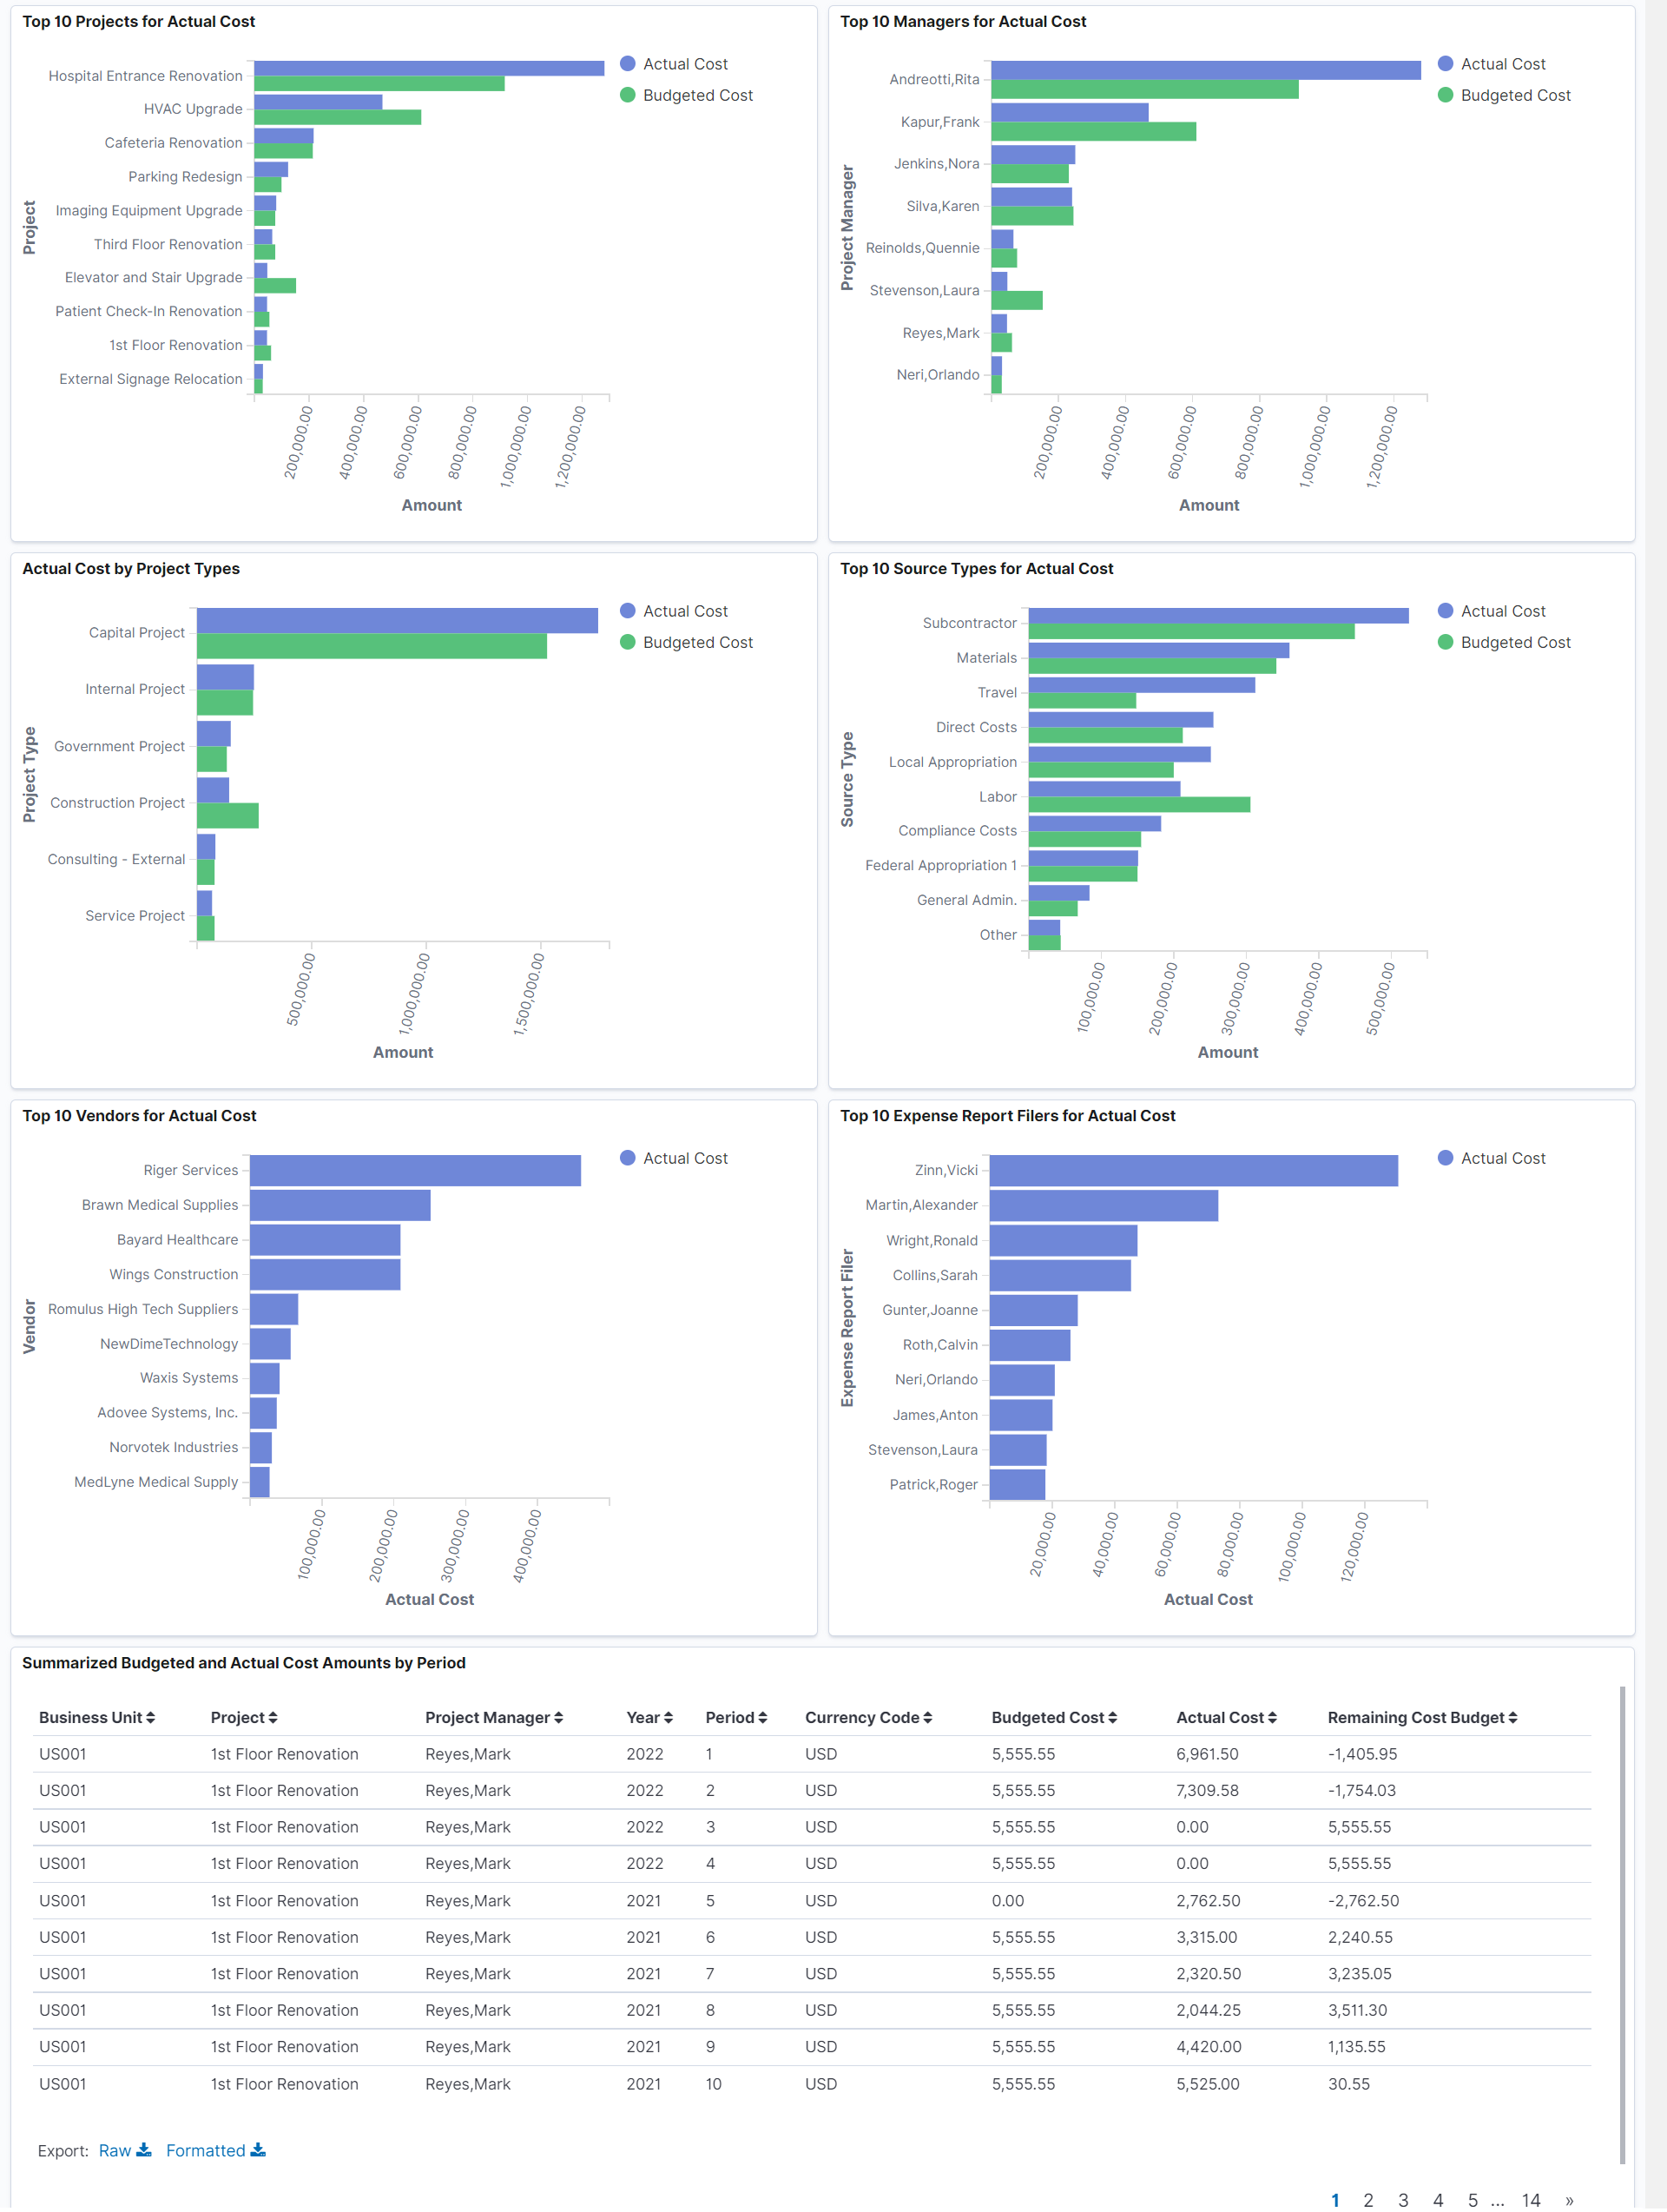
Summarized Budgeted and Actual Cost Amounts by Period grid displays the summarized Budgeted and Actual Cost amount over the time period.
Methods for Reporting Project Information
The following applies to the Project Cost, Project Billing, Project Revenue, and Year-Over-Year dashboards.
All transactions are displayed in the currency for the projects business unit. If selecting multiple business units in the filter, be sure to select business units with the same currency.
The Business Unit filter defaults the Business Unit from the user's Project Preferences. The accounting date range defaults the last month's using the current date.
Transactions are sourced from the project costing PROJ_RESOURCE table. Transactions are reported by month using the Accounting Date on the transaction. Accounting Dates are categorized by month and year using the monthly reporting calendar on the Project Installation Options page. See Reporting Roll Up Calendars section in Installation Options - Project Costing Page.
Analysis types and analysis groups are used for categorizing a transaction as budgeted cost, actual cost, billing, revenue and profit. The analysis groups are driven primarily from the installation options page and referenced in the underlying query supporting the index. Organizations should expect to change the logic in the underlying query to align with their use of project costing.
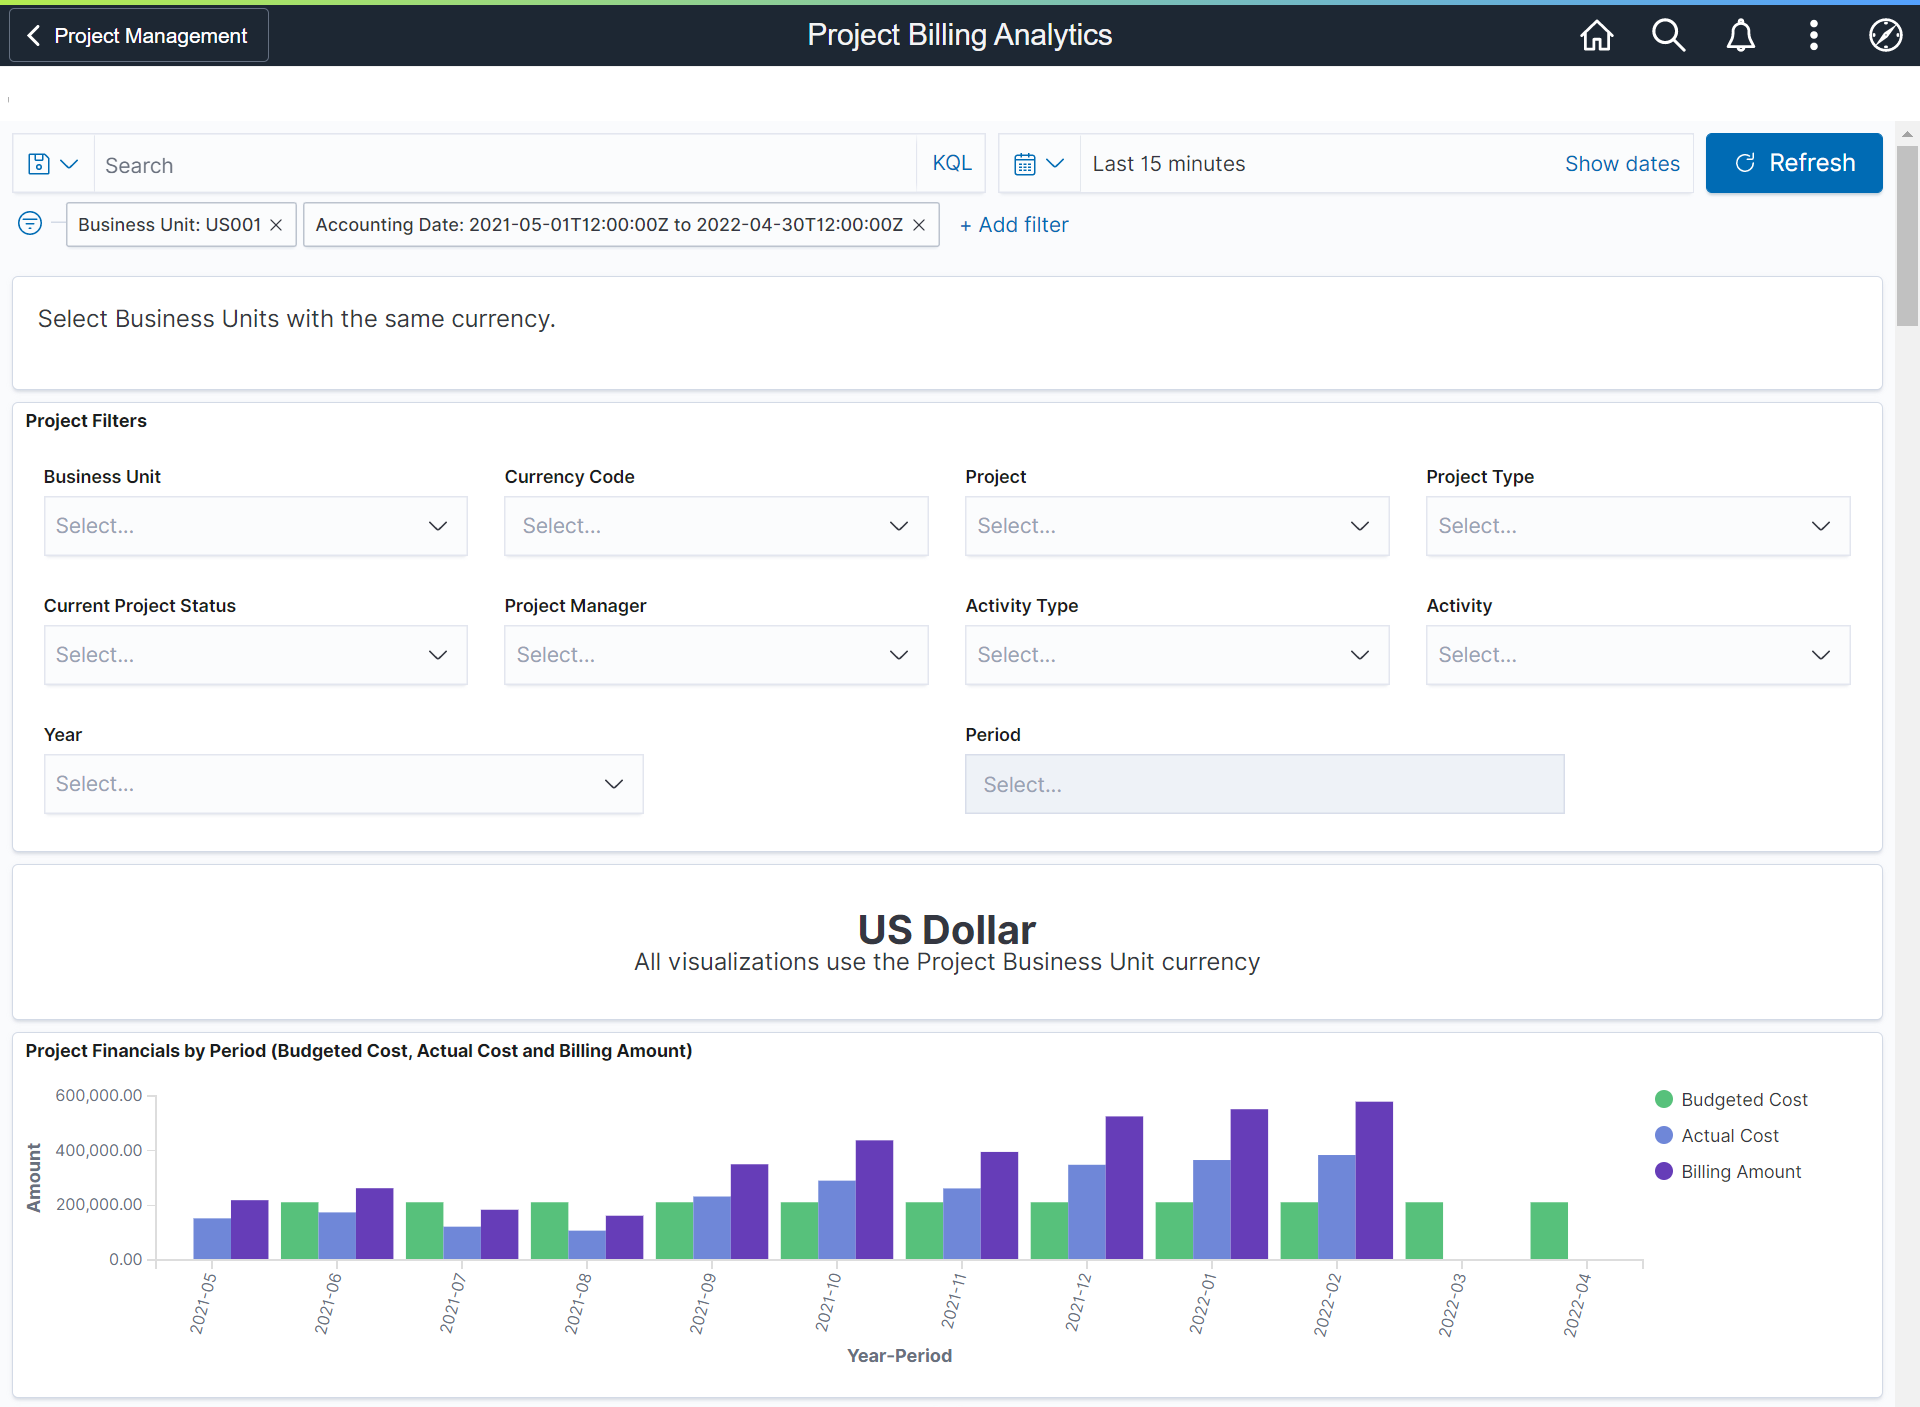
Use the Project Billing Analytics dashboard to analyze billings to customers and sponsors to budgeted cost and actual cost. This includes analytics by project, manager, vendor/supplier, and employee.
Navigation:
Select the Project Billing Analytics tile.
This example illustrates the fields and controls on the Project Billing Analytics Dashboard (1 of 2).
This example illustrates the fields and controls on the Project Billing Analytics Dashboard (2 of 2).

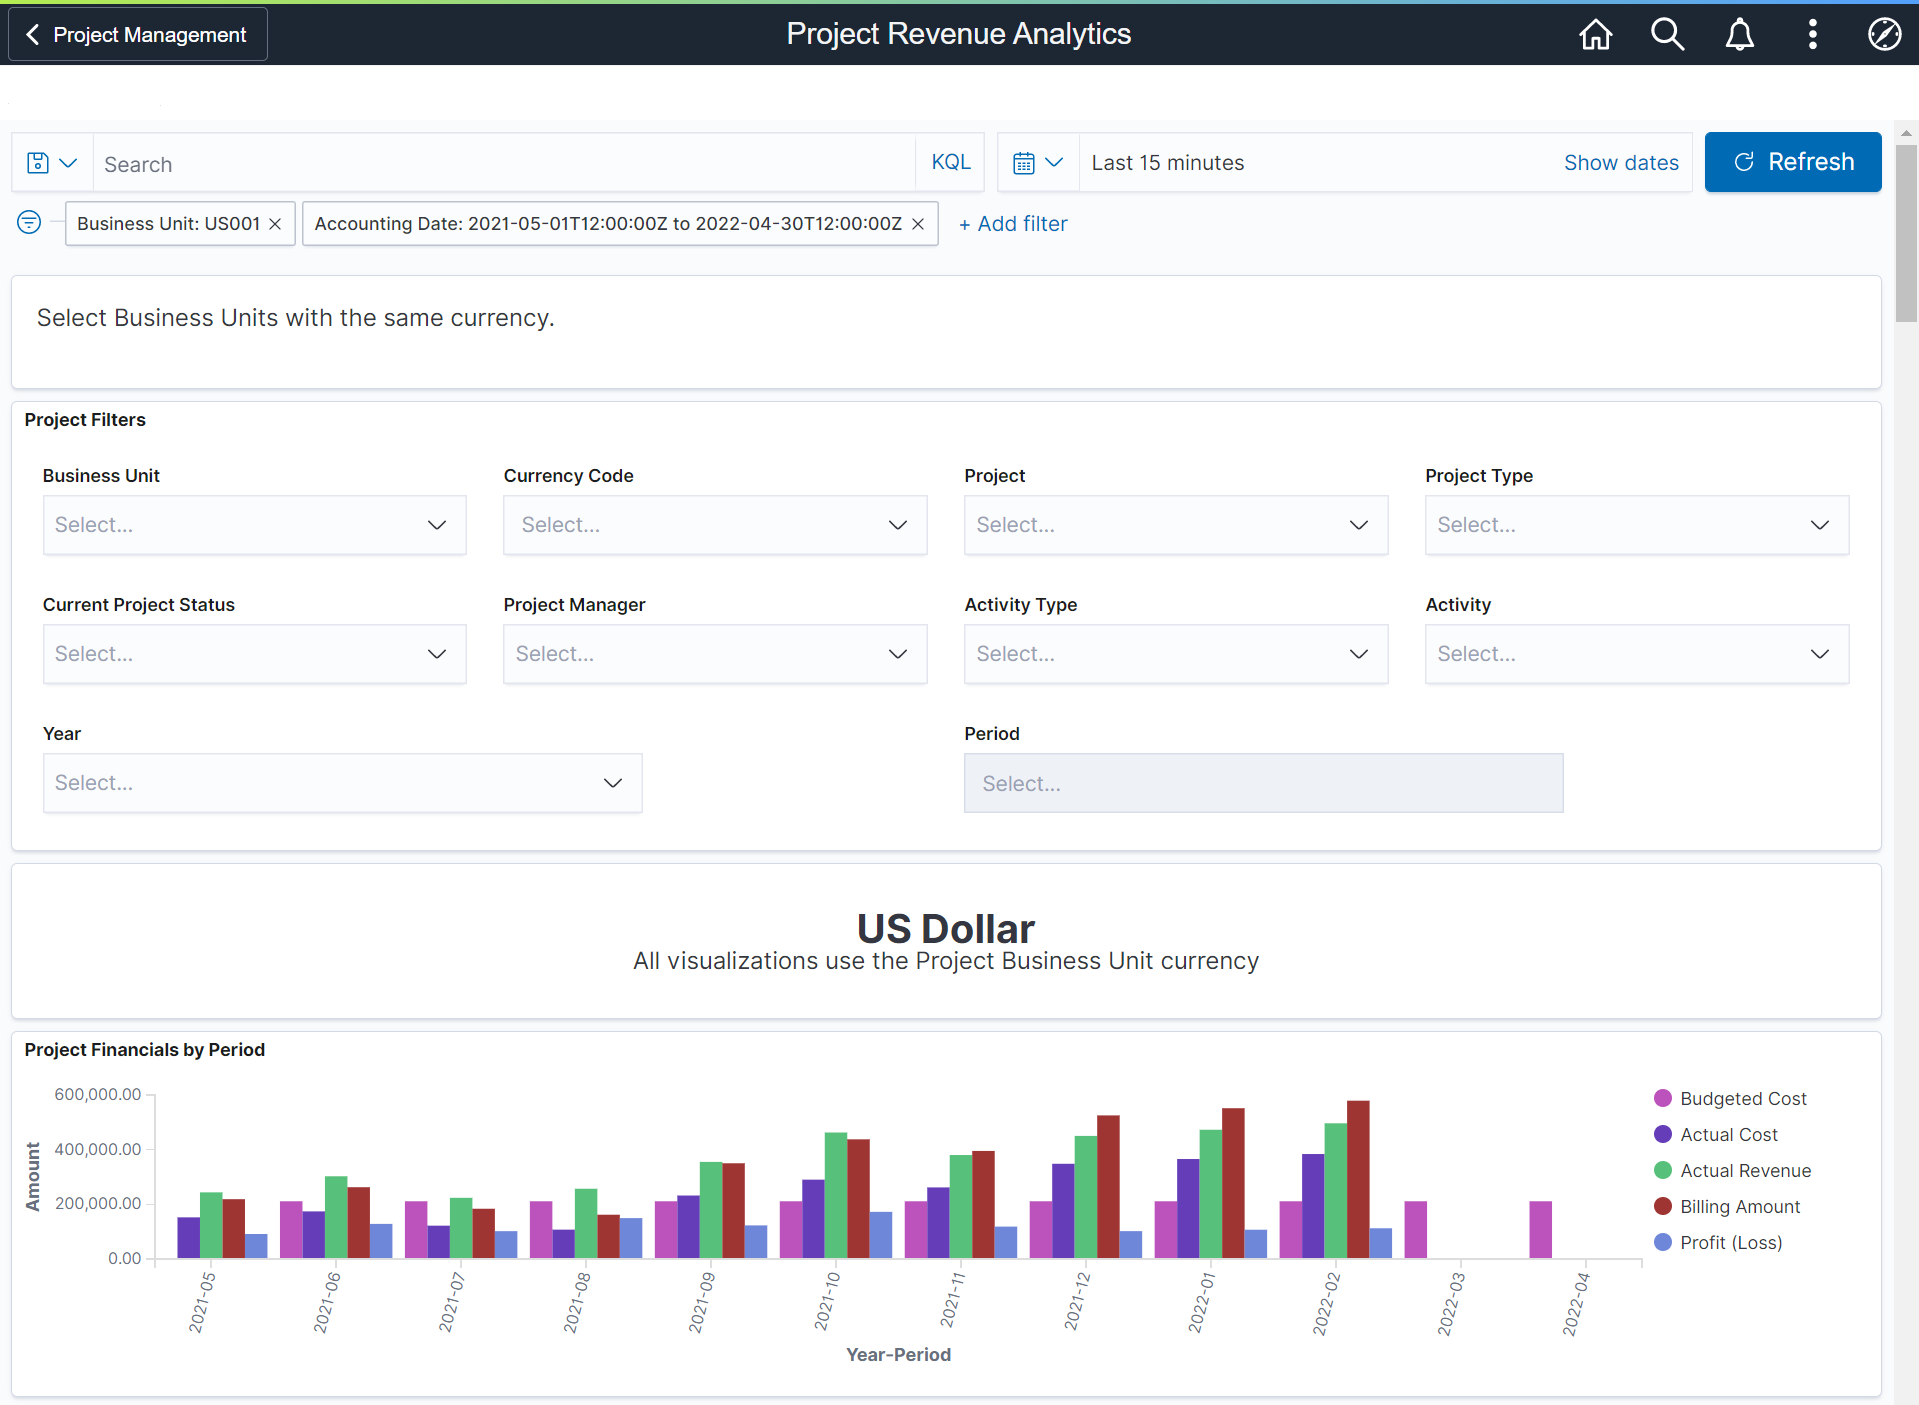
Use the Project Revenue Analytics dashboard to analyze Revenue, Billing, Budgeted Cost, Actual Cost, and Profit for your projects. This includes analytics by project, manager, vendor/supplier, and employee.
Navigation:
Select the Project Revenue Analytics tile.
This example illustrates the fields and controls on the Project Revenue Analytics Dashboard (1 of 2).
This example illustrates the fields and controls on the Project Revenue Analytics Dashboard (2 of 2).

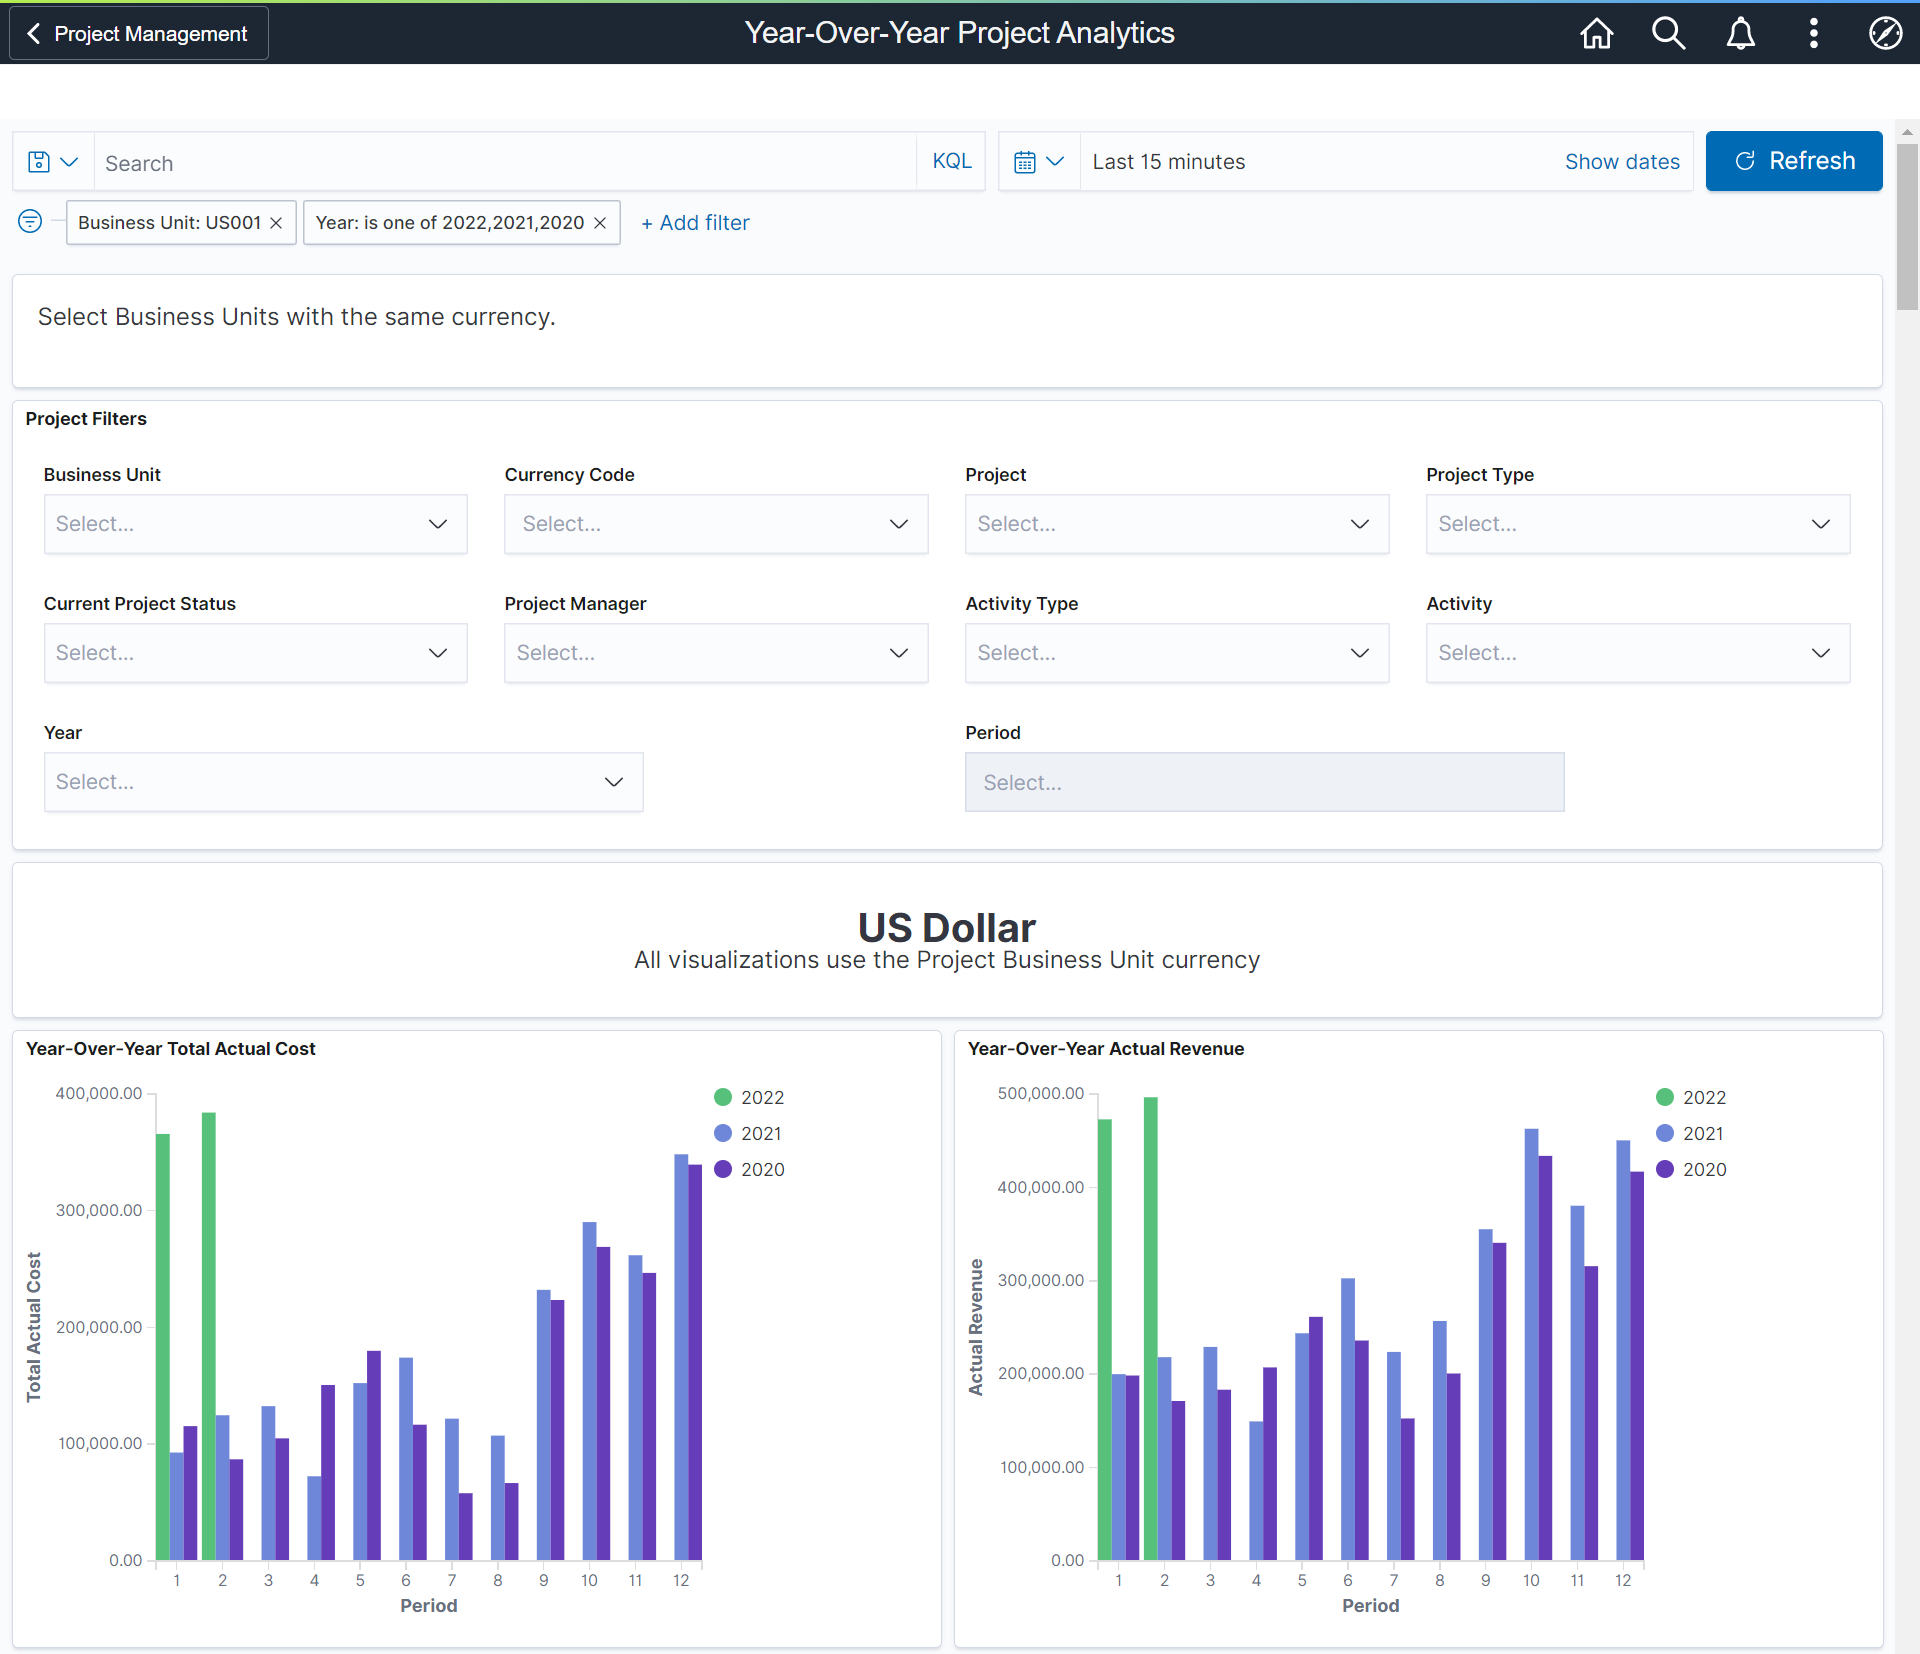
Use the Year-Over-Year Project Analytics dashboard to analyze Actual Cost, Billing, Revenue, and Profit for current and previous two years.
Navigation:
Select the Year-On-Year Project Analytics tile.
This example illustrates the fields and controls on the Year-Over-Year Project Analytics Dashboard (1 of 2).
This example illustrates the fields and controls on the Year-Over-Year Project Analytics Dashboard (2 of 2).
