Viewing Supplier Performance
This topic discusses how the suppliers view performance metrics using these pagelets.
You can also control the content and appearance of the performance pagelets at the reporting entity or supplier level.
This table provides details on PeopleSoft eSupplier Connection pagelets.
|
Pagelet Name |
Roles |
Audience |
Usage |
Enabling Applications |
|---|---|---|---|---|
|
On-Time Performance (WV_PE_METRIC_1) |
Supplier - Applications Administrator, Supplier - Customer Service Rep |
Supplier |
Displays the percentage and actual number of shipments that are on time, early, and late for all items within the period. |
PeopleSoft eSupplier Connection, PeopleSoft Purchasing |
|
PO/Receipt Qty Performance (WV_PE_METRIC_4) |
Supplier - Applications Administrator, Supplier - Customer Service Rep
|
Supplier |
Displays the percentage and actual number of supplier shipment quantities inspected, accepted, rejected, and returned by period. |
PeopleSoft eSupplier Connection, PeopleSoft Purchasing |
|
Quality Performance (WV_PE_METRIC_2) |
Supplier - Applications Administrator, Supplier - Customer Service Rep |
Supplier |
Displays the percentage and actual number of supplier shipment quantities inspected, accepted, rejected, and returned by period. |
PeopleSoft eSupplier Connection, PeopleSoft Purchasing |
|
Quantity Performance (WV_PE_METRIC_3) |
Supplier-Applications Administrator, Supplier-Customer Service Rep |
Supplier |
Displays the percentage and actual number of supplier shipments with correct quantities, over-shipment quantities, and under-shipment quantities by period. |
PeopleSoft eSupplier Connection, PeopleSoft Purchasing |
Use the On-Time Performance pagelet (WV_PE_METRIC_1) to display the percentage and actual number of shipments that are on time, early, and late for all items within the period.
Navigation:
Click the Customize button on the On-Time Performance supplier-facing pagelet.
This example illustrates the fields and controls on the On-Time Performance pagelet.
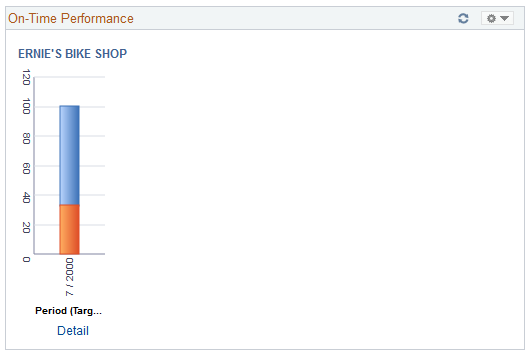
The pagelet features a graph that displays the percentage on time metric, the vendor name, and target percentages by period.
Click the Detail link to access the On-Time Performance page, and view the metrics used to derive this graph.
Use the Quantity Performance pagelet (WV_PE_METRIC_3) to display the percentage and actual number of supplier shipments with correct quantities, over-shipment quantities, and under-shipment quantities by period.
Navigation:
Click the Customize button on the Quantity Performance supplier-facing pagelet.
This example illustrates the fields and controls on the Quantity Performance pagelet.
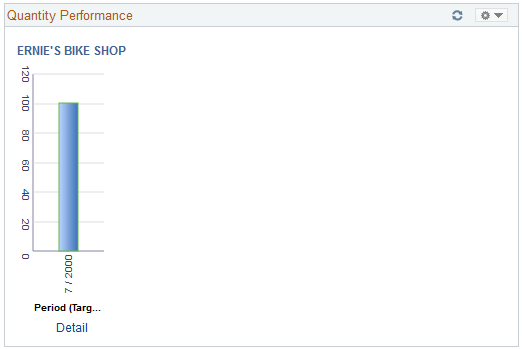
The pagelet features a graph that displays the supplier name, percentage correct, percentage under, percentage over, and target percentage.
Click the Detail link to access the Quantity Performance page, and view the metrics used to derive this graph.
Use the Quality Performance pagelet (WV_PE_METRIC_2) to display the percentage and actual number of supplier shipment quantities inspected, accepted, rejected, and returned by period.
Navigation:
Click the Customize button on the Quality Performance supplier-facing pagelet.
This example illustrates the fields and controls on the Quality Performance pagelet.

The pagelet features a quality performance graph that displays the percentage net received metric, supplier name, and target percentage.
Click the Detail link to access the Quantity Performance page, and view the metrics used to derive this graph.
Use the PO/Receipt Qty Performance pagelet (WV_PE_METRIC_4) to display the percentage and actual number of supplier shipment quantities inspected, accepted, rejected, and returned by period.
Navigation:
Click the Customize button on the PO/Receipt Quantity Performance supplier-facing pagelet.
The pagelet features a purchase order-versus-receipt quantity performance graph that displays the percentage open receipt quantity metric, supplier name, and target percentage by period.
Click the Detail link to access the PO/Receipt Quantity Performance page, and view the metrics used to derive this graph.