Using Diversity Analytics
This topic discusses diversity analytics for recruiting.
These videos demonstrate the diversity analytics:
Video: PeopleSoft HCM 9.2 Image 19 Highlights: Diversity Analytics (Diversity Overview Pivot Grid)
Video: PeopleSoft HCM 9.2 Image 20 Highlights: Diversity Analytics (Diversity By Applications Pivot Grid)
|
Page Name |
Definition Name |
Usage |
|---|---|---|
|
HRS_RUN_DIVERSITY |
Run the two application engine processes that load diversity data into the diversity analytics tables. |
|
|
HRS_PG_DIV_OV1 |
View diversity data by applicant. |
|
|
HRS_PG_DA_APPLN |
View diversity data by application. |
Diversity analytics provide a mechanism to review your recruitment practices and your compliance with affirmative action and equal employment opportunity programs. The Diversity analytics are pivot grids that chart information about four important types of diversity: disability, ethnicity, gender, and veteran status. The charts offer a variety of filter criteria for viewing specific slices of data.
Diversity Charts
The system provides two pivot grids with different ways of looking at diversity information:
Applicant Diversity Overview: This pivot grid counts each included applicant just once, regardless of how many times the applicant has applied. You can see applicant data for all four diversity types at once, or you can drill down for a closer look at a specific diversity type.
Diversity by Application: This pivot grid counts each application separately, so an applicant who applies for multiple jobs is counted once for each application. (However, if an applicant has more than one application for a single job opening, only the most recent application is counted.) This pivot grid shows one diversity type at a time and provides prompts so you can change which diversity type is displayed.
Access both charts from the Diversity Analytics Pagelet on the Recruiting Home page.
Effective Dated Diversity Data
Disability and veteran statuses are both effective dated. Gender and ethnicity data is not effective-dated.
The two pivot grids handle the effective-dated data differently:
The Applicant Diversity Overview pivot grid always shows current applicant data. This is appropriate for an analysis of applicants (rather than applications).
The Diversity by Application pivot grid uses the disability and veteran information from the time of the most recent disposition change. This architecture supports the ability to analyze the diversity of your applicant pool at different stages of the recruiting process. For example, you can compare the diversity of all applicants who apply versus the diversity of applicants who reach the interview phase, the offer phase, and the hiring phase. This analysis involved drilling down to view the data by disposition.
Notes on Specific Diversity Values
This list provides important information about certain diversity values that appear in the charts:
Multiple Ethnicities: An applicant with more than one ethnic group is classified as Multiple in the diversity analytics charts.
Disability Data: An applicant who does not have data in the USA-specific Section 503 Disability Status section of the Create Applicant page: Eligibility & Identity Tab is still considered disabled if the non-country specific Disability check box is selected on that same page.
Not Indicated or Unknown Diversity Data: The labels Not Indicated (for disability, ethnicity, and veteran status) and Unknown (for gender) are actual database values that are delivered by PeopleSoft.
Loading Diversity Data
The pivot grids for diversity analytics do not read data directly from the main recruiting tables. Instead, two Application Engine processes load diversity data into dedicated analytics tables:
The Refresh Diversity Analytics process (HRS_PG_DA) loads data for the Applicant Diversity Overview pivot grid.
The Refresh Application Diversity process (HRS_DA_APPLICATION) loads data for the Diversity by Application pivot grid.
When you run this process, you can specify the date range for the data to be loaded. Applicants are loaded if they submitted applications with or without a job opening in the specified date range. However, the process does not load applicant data for:
Applications in Draft status.
Applications in Withdrawn status with a reason of Candidate Withdrawn.
Applications in Inactive status.
Applicants in Inactive or Queued status.
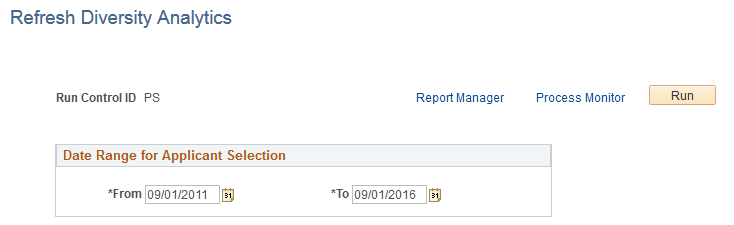
Use the Refresh Diversity Analytics page (HRS_RUN_DIVERSITY) to run the two application engine processes that load diversity data into the diversity analytics tables.
Navigation:
This example illustrates the Refresh Diversity Analytics page.
Field or Control |
Description |
|---|---|
Run |
Click this button to access the PeopleSoft Process Scheduler Request page, where you schedule the Refresh Diversity Analytics process, the Refresh Application Diversity process, or both. |
Date Range for Applicant Selection
Field or Control |
Description |
|---|---|
From and To |
Specify a date range for the process. The system loads diversity data for applicants who submitted applications (with or without a job opening) within the specified date range. The default date range extends back five years from the current date. |
Use the Applicant Diversity Overview pivot grid (HRS_PG_DIV_OV1) to view diversity data by applicant.
Note: This chart counts each applicant once, regardless of how many applications have been submitted.
Navigation:
Access the Diversity Analytics pagelet on the Recruiting Home page. Click the Diversity Analytics menu, then select the Applicant Diversity Overview menu item.
This example illustrates the Applicant Diversity Overview pivot grid.
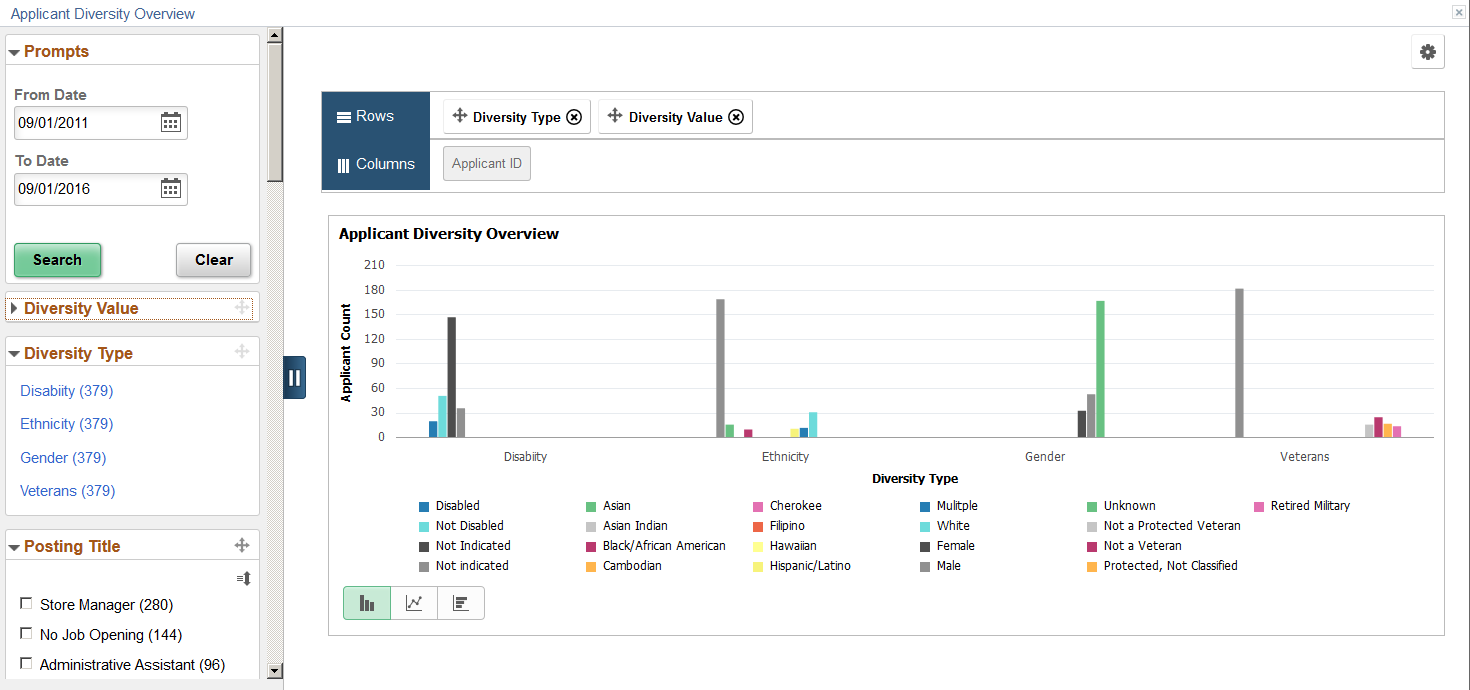
The Diversity Overview pivot grid includes a left frame with prompts and filters and a right frame with a chart.
General Pivot Grid Functionality
Pivot grids are a feature of PeopleTools. For general information on setting up and using pivot grids, see PeopleTools: Pivot Grid. This topic does not discuss the generic pivot grid page controls such as the Rows and Columns controls or the Options icon in the top right corner.
Chart
When the page first opens, it displays a bar chart with four types of diversity data: Disability, Ethnicity, Gender, and Veterans (veteran status). The bars for each diversity type are clustered together, creating the effect of four bar charts side-by-side.
When all four diversity types are displayed, mouseover text can help you match data bars to the labels in the legend. Hover over a bar to see the label, or hover over a label to highlight the associated bar.
Use standard pivot grid controls to change the chart to a line chart or a horizontal bar chart.
Prompts
Field or Control |
Description |
|---|---|
From Date and To Date |
Enter the date range that you want to analyze. The pivot grid displays data for applicants with applications that were submitted within the specified date range. The default date range extends back one month from the current date. The selected date range determines which applicants are included in the chart, but it is not used to look up effective-dated diversity data. Rather, the chart always displays the current data for an applicant. |
Search |
Click to refresh the chart based on the date range that you specify. |
Filters
For the first two filters, Diversity Value and Diversity Type, you apply the filter by clicking the link for a single value. For all other filters, there are check boxes next to the values, and you can select multiple values to include in your data set.
An explanation of the counts that appear next to each filter value appears after this list of filters.
Field or Control |
Description |
|---|---|
Diversity Value |
This filter includes specific values for all of the different types of diversity shown in the chart. Because this filter initially includes a mix of values that apply to gender, ethnicity, disability status, and veteran status, it is usually easiest to filter by diversity type before filtering by diversity value. |
Diversity Type |
These filter values represent the four types of data included in the chart: Disability, Ethnicity, Gender, and Veterans. Click a value to update the chart so that it shows only data related to the selected diversity type. |
Posting Title |
Filtering by posting title is useful when you want to eventually drill down to a single job opening. Filtering by posting title reduces the number of values in the Job Opening ID filter to a more manageable list. Applications that do not include a job opening have a posting title of No Job Opening. |
Job Opening ID |
Use this filter to review the diversity data for specific job openings. Applications that do not include a job opening have a job opening ID of 0 (zero). |
Applicant Status |
These filter values represent the applicant’s overall status, not the disposition of specific applications. Applicants that are included in this analytic always have a status of Active or Hired. |
Recruiter |
Enables you to filter based on the primary recruiter for the job opening. |
Hiring Manager |
Enables you to filter based on the primary hiring manager for the job opening. |
Jobcode |
Enables you to filter based on the primary job code for the job opening. |
Job Family |
Enables you to filter based on the job family for the job opening. |
Recruiting Location |
Enables you to filter based on the primary recruiting location for the job opening. |
Business Unit |
Enables you to filter based on the business unit of the job opening. |
Department |
Enables you to filter based on the department of the job opening. |
Understanding the Counts That Appear Next To Filter Options
In the Applicant Diversity Overview chart, the counts that appear next to the filter options do not necessarily correspond to the number of applicants who have a particular attribute. This peculiarity is related to the fact that the underlying table stores data by job application rather than applicant. This architecture enables you to review diversity data based on job-related criteria—for example, you can look at applicant diversity for specific departments or recruiting locations.
To understand how the filter counts work, consider the example of Maya Hill, who submitted three applications. The analytics table therefore has three rows of data for Maya. Maya’s diversity information is included in the chart as long as any of her three applications meet your filtering criteria.
In the bar chart on the right frame of the page, each diversity type counts Maya just once, regardless of how many applications she submitted. That is, Maya is counted as one female, not three, even though she has three applications, as shown in the following illustration.
This example illustrates the Applicant Diversity Overview pivot grid for a data set that includes one applicant with three applications. The chart shows one applicant for each diversity type.
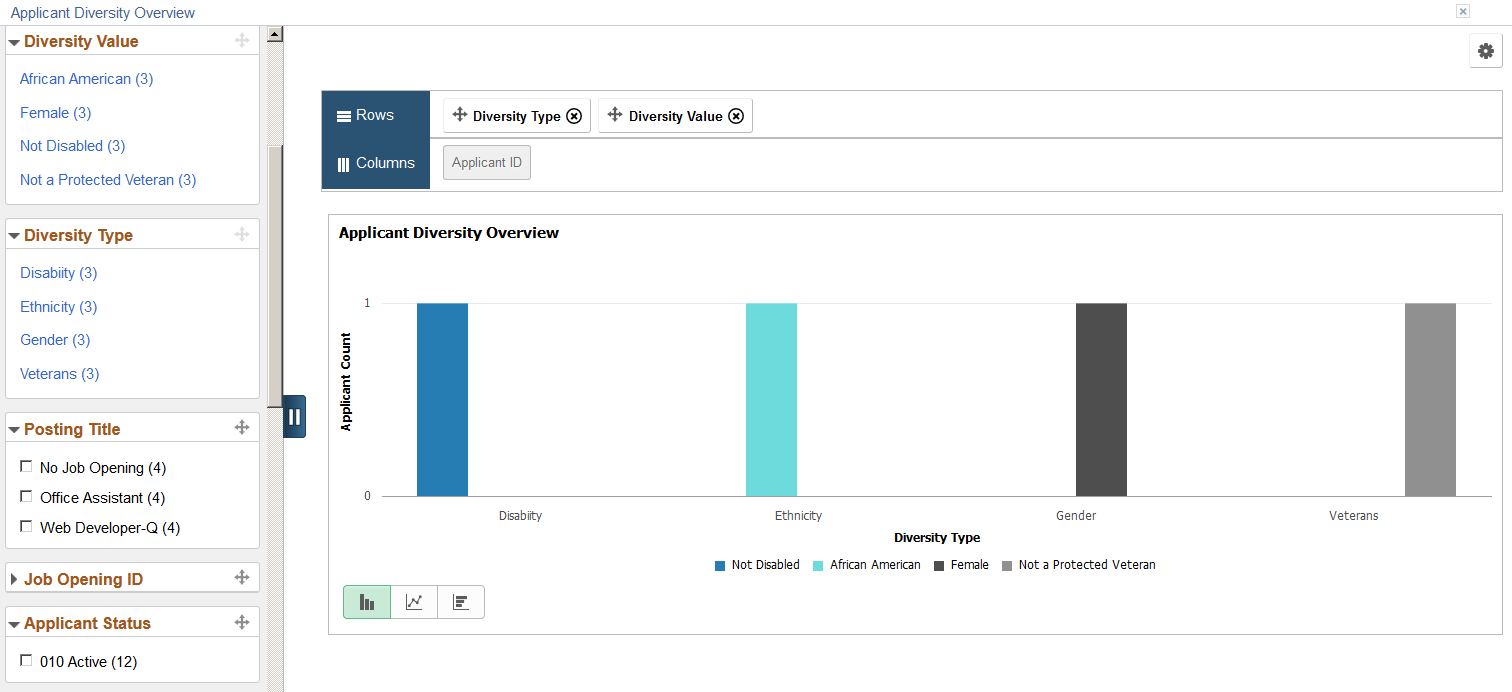
Although the chart counts Maya once per diversity type, the counts that appear in parentheses next to filter values count each of Maya’s applications and each of Maya’s diversity types. The following table summarizes how this works. The Example column refers to Maya’s three applications as shown in the previous illustration.
|
Filter |
Associated Count |
Example |
|---|---|---|
|
Diversity Value |
Counts applications. |
Maya submitted three applications, so even though the bar chart shows that there is one female, the Female filter shows a count of 3. |
|
Diversity Type |
Counts applications. All diversity types have the same count because every application is considered for each diversity type. |
All four diversity types show a count of 3 because Maya submitted three applications. |
|
All other filters |
When all four diversity types appear in the chart, the count for these filters is four times the number of applications that meet the criteria. This is because each application is counted once for each diversity type. If you filter the chart to show only one diversity type, then the counts for these other filters match the number of applications. |
Each of Maya’s three job applications are represented four times in the chart: once for disability, once for ethnicity, once for gender, and once for veteran status. So a filter value that includes one of Maya’s application applications shows a count of 4. The Applicant Status filter, however, has a higher count. Maya’s application status, Active, does not vary by application, so the Active filter includes all three applications. Because each application is counted four times (for the four diversity types), Maya’s count for this filter is 12. |
Reviewing Detailed Data
If you drill down into the chart, you can access a grid that displays the source data. The grid lists job applications, so individual applicants can appear more than once.
The grid that appears on-screen when you drill down into the chart shows a maximum of 100 rows. To view the complete data set, use the standard pivot grid export option by clicking the Options icon in the top right corner of the chart. The export is limited to data that falls within the date range you specify in the Prompt fields, but all other filter criteria is ignored.
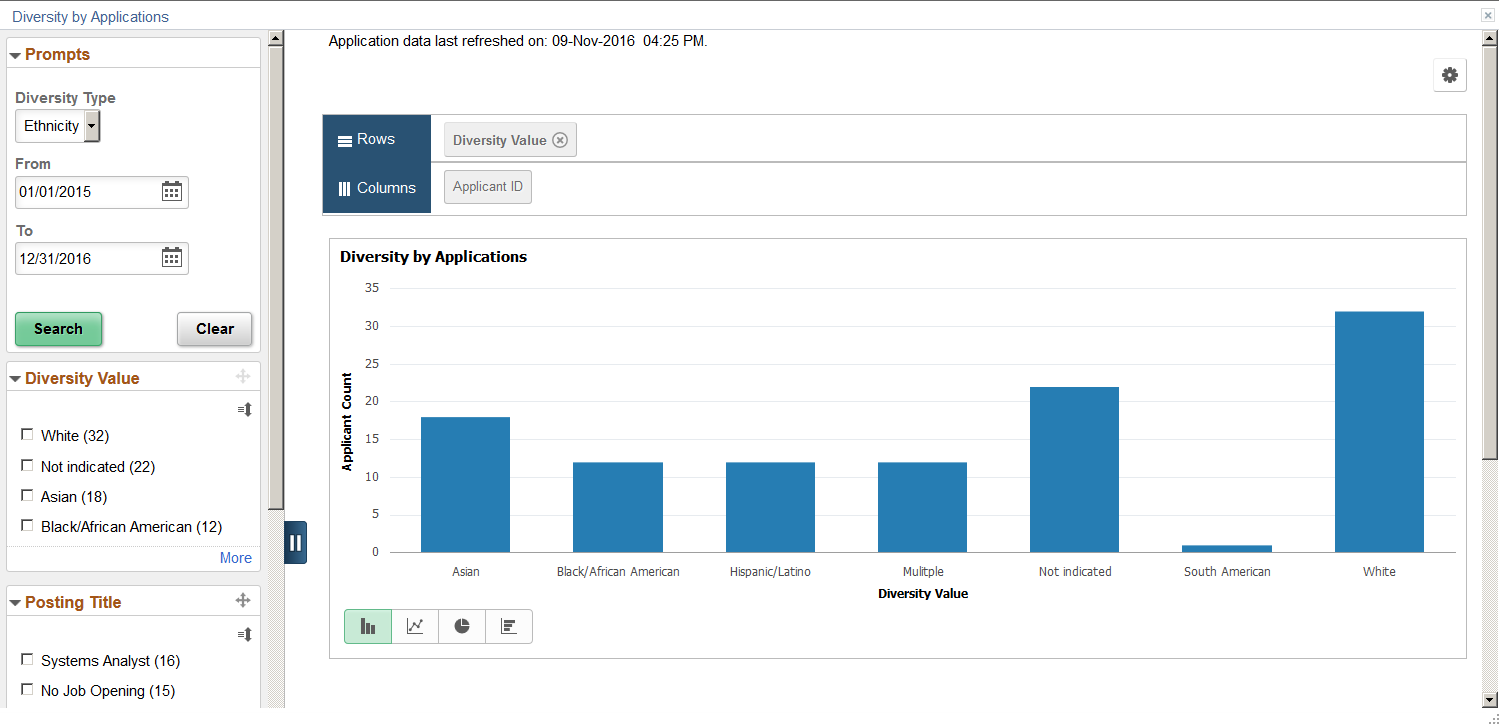
Use the Diversity by Applications pivot grid (HRS_PG_DA_APPLN) to view diversity data by application.
Note: If an applicant applies for multiple jobs within the specified date range, this chart counts each application separately. If an applicant has more than one application for a single job opening, only the most recent application is counted.
Navigation:
Access the Diversity Analytics pagelet on the Recruiting Home page. Click the Diversity Analytics menu, then select the Diversity by Applications menu item.
This example illustrates the Diversity by Applications pivot grid.
General Pivot Grid Functionality
Pivot grids are a feature of PeopleTools. For general information on setting up and using pivot grids, see PeopleTools: Pivot Grid. This topic does not discuss the generic pivot grid page controls such as the Rows and Columns controls or the Options icon in the top right corner.
Chart
When the page first opens, it displays a bar chart showing gender information for applications that were submitted in the last month. Use standard pivot grid controls to change the chart type, to drill down into the chart, or to view the underlying data in grid form.
Effective-Dated Diversity Information
Gender data and ethnicity data are not effective dated. The applications that are included in the chart are always associated with the applicant’s current gender and ethnicity data.
Disability and veteran information are effective dated. Each application is associated with the disability and veteran information that was effective as of the most recent disposition change.
For example, Marcus was not disabled on January 15 when he applied for two jobs, Job A and Job B. He passed screening for both jobs, resulting in a disposition change to Screen.
On January 30, while still in the Screen disposition for both jobs, Marcus became disabled, and his new disability information was entered into the system. In spite of this change, the Diversity by Applications chart still shows a Not Disabled value for both applications because Marcus was not disabled at the time of the most recent disposition change. This presentation reflects the fact that Marcus’s disability status is unrelated to his screening results.
In February, Marcus was asked to interview for Job A, and his disposition for that job changed to Interview. At this point, the chart shows a Disabled value for Job A because Marcus was disabled at the time of the most recent disposition change. However, the chart still shows a Not Disabled value for Job B because the Screen disposition has not changed.
In March, Marcus was hired for Job A, so his Job A disposition changed to Hired and his job B disposition changed to Rejected. He was still disabled at the time of these disposition changes, so at this point the chart shows that his disability value for both applications is now Disabled.
Prompts
Field or Control |
Description |
|---|---|
Diversity Type |
The default diversity type for the chart is Gender. Select Disability, Ethnicity, or Veterans to change the diversity type on the chart. |
From Date and To Date |
Enter the date range that you want to analyze. The pivot grid displays data for applications that were submitted within the specified date range. The default date range extends back one month from the current date. The date range you specify here controls which applications are included in the chart, but once an application is included, these dates are not used when looking up the disability or veteran status for the application. For example, if an application’s disposition changes after the specified To Date, the disposition date (and not the To Date) is used to look up the associated disability and veteran status. |
Search |
Click to refresh the chart based on the date range that you specify. |
Filters
To filter the diversity data, select the check boxes next to the values that you want to include. You can select multiple filters to define your data set.
The number next to each filter value is the count of how many applications have that value.
Field or Control |
Description |
|---|---|
Diversity Value |
This filter includes values that are specific to the diversity type shown in the chart. For example, if the chart displays gender data, filter values can include Female, Male, and Unknown. |
Posting Title |
Filtering by posting title is useful when you want to eventually drill down to a single job opening. Filtering by posting title reduces the number of values in the Job Opening ID filter to a more manageable list. Applications that do not include a job opening have a posting title of No Job Opening. |
Job Opening ID |
Use this filter to review the diversity data for specific job openings. Applications that do not include a job opening have a job opening ID of 0 (zero). |
Recruiter |
Enables you to filter based on the primary recruiter for the job opening. |
Hiring Manager |
Enables you to filter based on the primary hiring manager for the job opening. |
Jobcode |
Enables you to filter based on the primary job code for the job opening. |
Application Month |
Enables you to filter based on the month that the application was submitted. |
Reviewing Detailed Data
If you drill down into the chart, you can access a grid that displays the source data. The grid lists job applications, so individual applicants can appear more than once.
The grid that appears on-screen when you drill down into the chart shows a maximum of 100 rows. To view the complete data set, use the standard pivot grid export option by clicking the Options icon in the top right corner of the chart. The export is limited to data that meetings the criteria you specify in the Prompt fields, but all other filter criteria is ignored.