Using the PeopleSoft Fluid User Interface to View Recruiting Analytics
This topic discusses how recruiters, recruiting managers and recruiting administrators use the Recruiting Insight tile to access the Recruiting Insight home page to view the detailed recruiting analytics, such as pivot grids for Time to Fill Jobs, Job Opening Aging, In Process Applicants and Jobs Opened/Closed, and various Recruiting Insights Dashboards.
Users with the Recruitment Administrator role have access to two additional analytic tiles: Applicant Diversity tile and Applications Diversity tile.
For general information about fluid pages in PeopleSoft HCM, see Understanding PeopleSoft Fluid User Interface Homepages.
For more information about Recruiting Pivot grids, see Understanding Recruiting Pivot Grids and Understanding Diversity Analytics.
|
Page Name |
Definition Name |
Usage |
|---|---|---|
|
HC_HRS_MY_ANALYTICS_FL_LINK (cref for the tile) |
Access the Recruiting Insight home page, with various dynamic tiles showing different analytic charts. |
|
|
HC_HRS_APPLICATION_DBRD_FL (cref for the tile) |
Access the Application Details Insights dashboard. |
|
|
HC_HRS_RECRUITER_DBRD_FL (cref for the tile) |
Access the Recruiter Pipeline Insights dashboard. |
|
|
HC_HRS_RECRUITMENT_ADM_DBRD_FL (cref for the tile) |
Access the Recruitment Admin Dashboard. |
|
|
HC_HRS_PG_TTF_MY_ANALYTICS_FL (cref for the tile) |
View a bar graph showing the user’s average number of days to fill a job opening for a specified time period. |
|
|
HC_HRS_PG_J_AG_MY_ANALYTICS_FL (cref for the tile) |
View a chart showing data for job openings based on the user’s security access. |
|
|
HC_HRS_PG_APP_MY_ANALYTICS_FL (cref for the tile) |
View the distribution of dispositions for applicants who are being considered for job openings, based on the user’s security access. |
|
|
HC_HRS_PG_JO_OC_FL (cref for the tile) |
View the number of job openings that were opened and closed each month, based on the user’s security access. |
|
|
HC_HRS_PG_DIV_OV_FL |
View diversity data by applicant. |
|
|
HC_HRS_PG_DA_APPLN_FL |
View diversity data by application. |
PeopleSoft Pivot Grid is a PeopleTools technology that provides operational analytics using charts and grids. Pivot grids enable users to visually display real-time data and organize it on the fly by pivoting and filtering. The self-service, multi-dimensional analytics provided by PeopleSoft Pivot Grid provides users with the business intelligence needed to make informed decisions.
Recruiting Solutions delivers four pivot grids that provide graphic views of important performance measures:
Job Opened/Closed chart shows data related to the number of openings that are opened and closed on a monthly basis, giving users a picture of hiring activity across time, departments and locations.
The Job Opening Aging Analysis chart shows the number of open job openings in various pre-defined age bands, providing vital information about an organization’s recruiting backlog.
The In Process Applicants chart shows the distribution of dispositions for applicants who are being considered for job openings, offering a view of the applicant pipeline.
The Time to Fill Jobs chart shows the monthly average Time to Fill data, helping users to see trends in their ability to fill job openings.
This data is available to Recruiters, Recruiting Managers and Recruiting Administrators also through various other recruiting tiles. Hiring Managers can access some of these analytics through the Recruiting Activities tile on the Manager Self Service.
For more information on the setup and capabilities of PeopleSoft Pivot Grid, see PeopleTools: Pivot Grid.
These page controls appear on all Recruiting pivot grids:
Field or Control |
Description |
|---|---|
|
Click to open the Options Menu, then select from these menu items:
|
<Drilldown Menu> |
When you click a data element (for example, a bar on a bar chart), the Actions menu provides these options:
|

Use the Recruiting Insight tile (cref for the tile is HC_HRS_MY_ANALYTICS_FL_LINK) to access the Recruiting Insight Tile.
Navigation:
Access the Recruiting Insight tile from the Fluid Recruiting home page.
This example illustrates the Recruiting Insight tile.
Use the Recruiting Insight Home page to access the recruiting insights dashboards and pivot grids.
Navigation
This example illustrates the fields and controls on the Recruiting Insight home page.
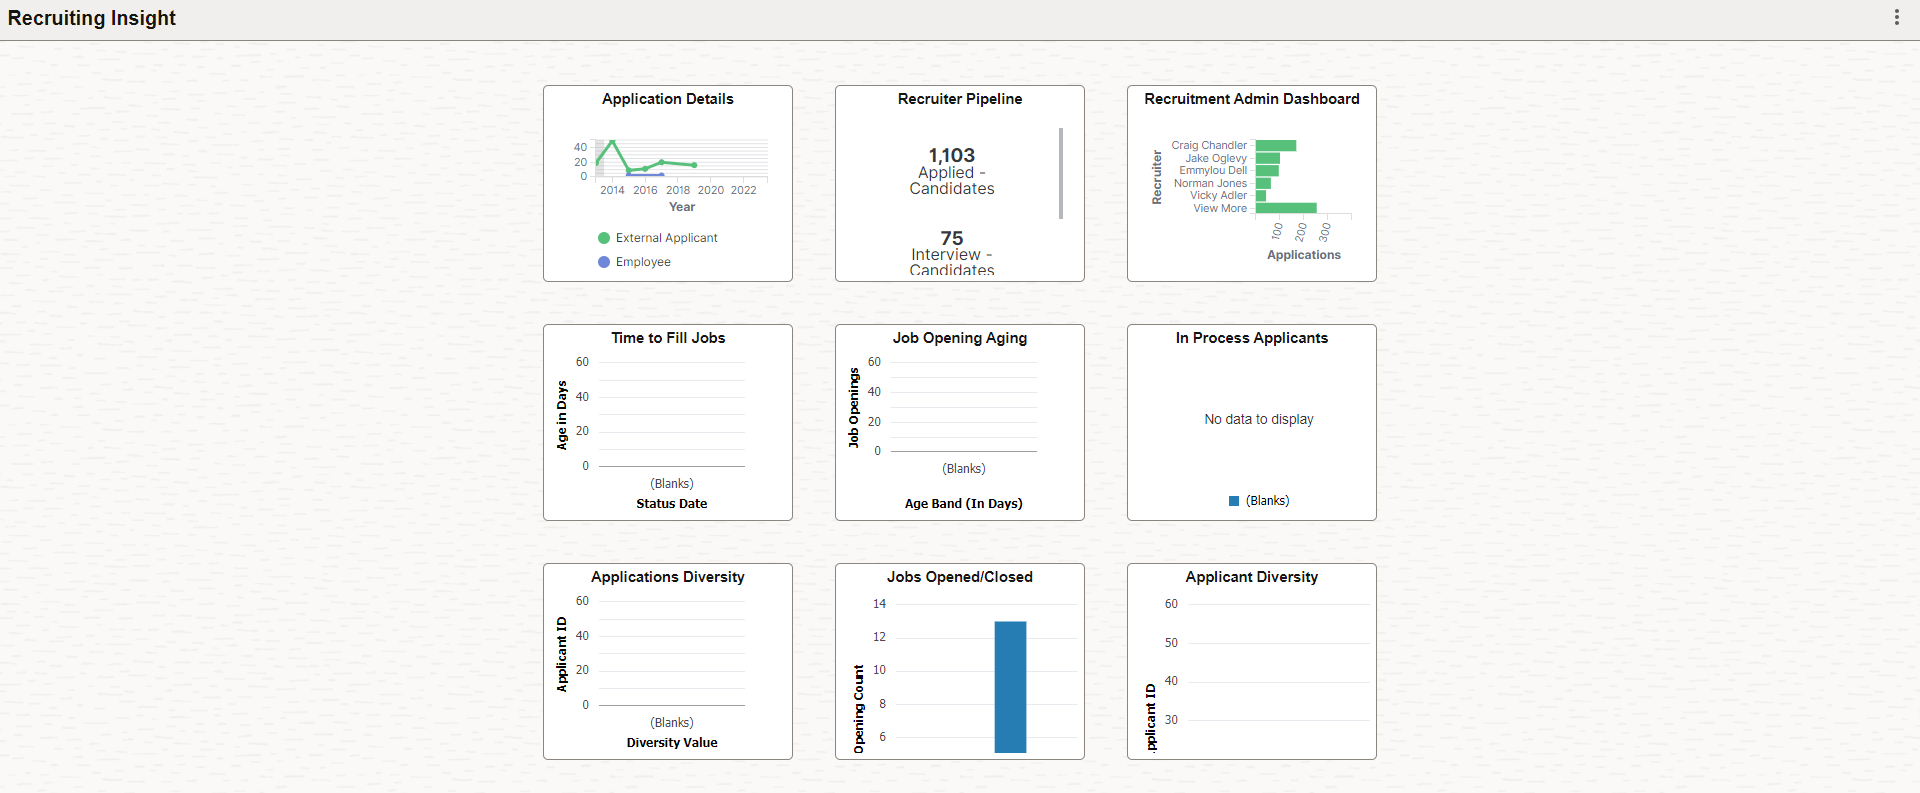
To know more on recruiting insight dashboards, see Viewing Recruiting Insights.
Use the Application Details tile (HC_HRS_APPLICATION_DBRD_FL) to access the Application Details dashboard and view different visualization on applicant details.
Navigation:
This example illustrates the fields and controls on the Application Details tile.
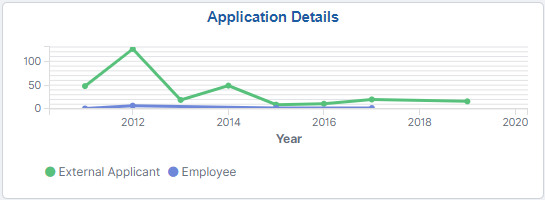
Click the tile to access the Application Details Insights Dashboard.
Use the Recruiter Pipeline tile to access the Recruiter Pipeline dashboard and gain insights into the job openings based on the logged in recruiter.
Navigation
This example illustrates the fields and controls on the Recruiter Pipeline tile.
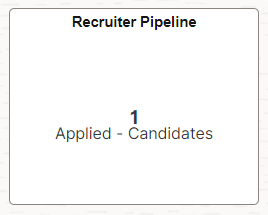
Click the tile to access the Recruiter Pipeline Dashboard.
Use the Recruitment Admin Dashboard Tile to access the Recruitment Admin Dashboard and gain insights into the recruiter data.
Navigation
This example illustrates the fields and controls on the Recruitment Admin Dashboard tile.
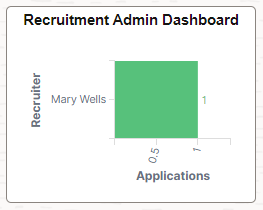
Click the tile to access the Recruitment Admin Dashboard.
Use the Time to Fill Jobs tile (cref for the tile is HC_HRS_PG_TTF_MY_ANALYTICS_FL) to view a bar graph showing the user’s average number of days to fill a job opening for a specified time period.
Navigation:
Click the Recruiting Insight tile on Fluid Recruiting Homepage. The Time to Fill Jobs tile is on the Recruiting Insight home page.
This example illustrates the Time to Fill Jobs tile.
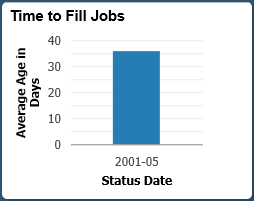
Click anywhere on the tile to access the Time to Fill Jobs pivot grid.
Use the Time to Fill Jobs pivot grid to view the average number of days to fill job openings by month.
Navigation:
Click the Time to Fill Jobs tile on the Recruiting Insight home page.
This example illustrates the fields and controls on the Time to Fill Jobs pivot grid.
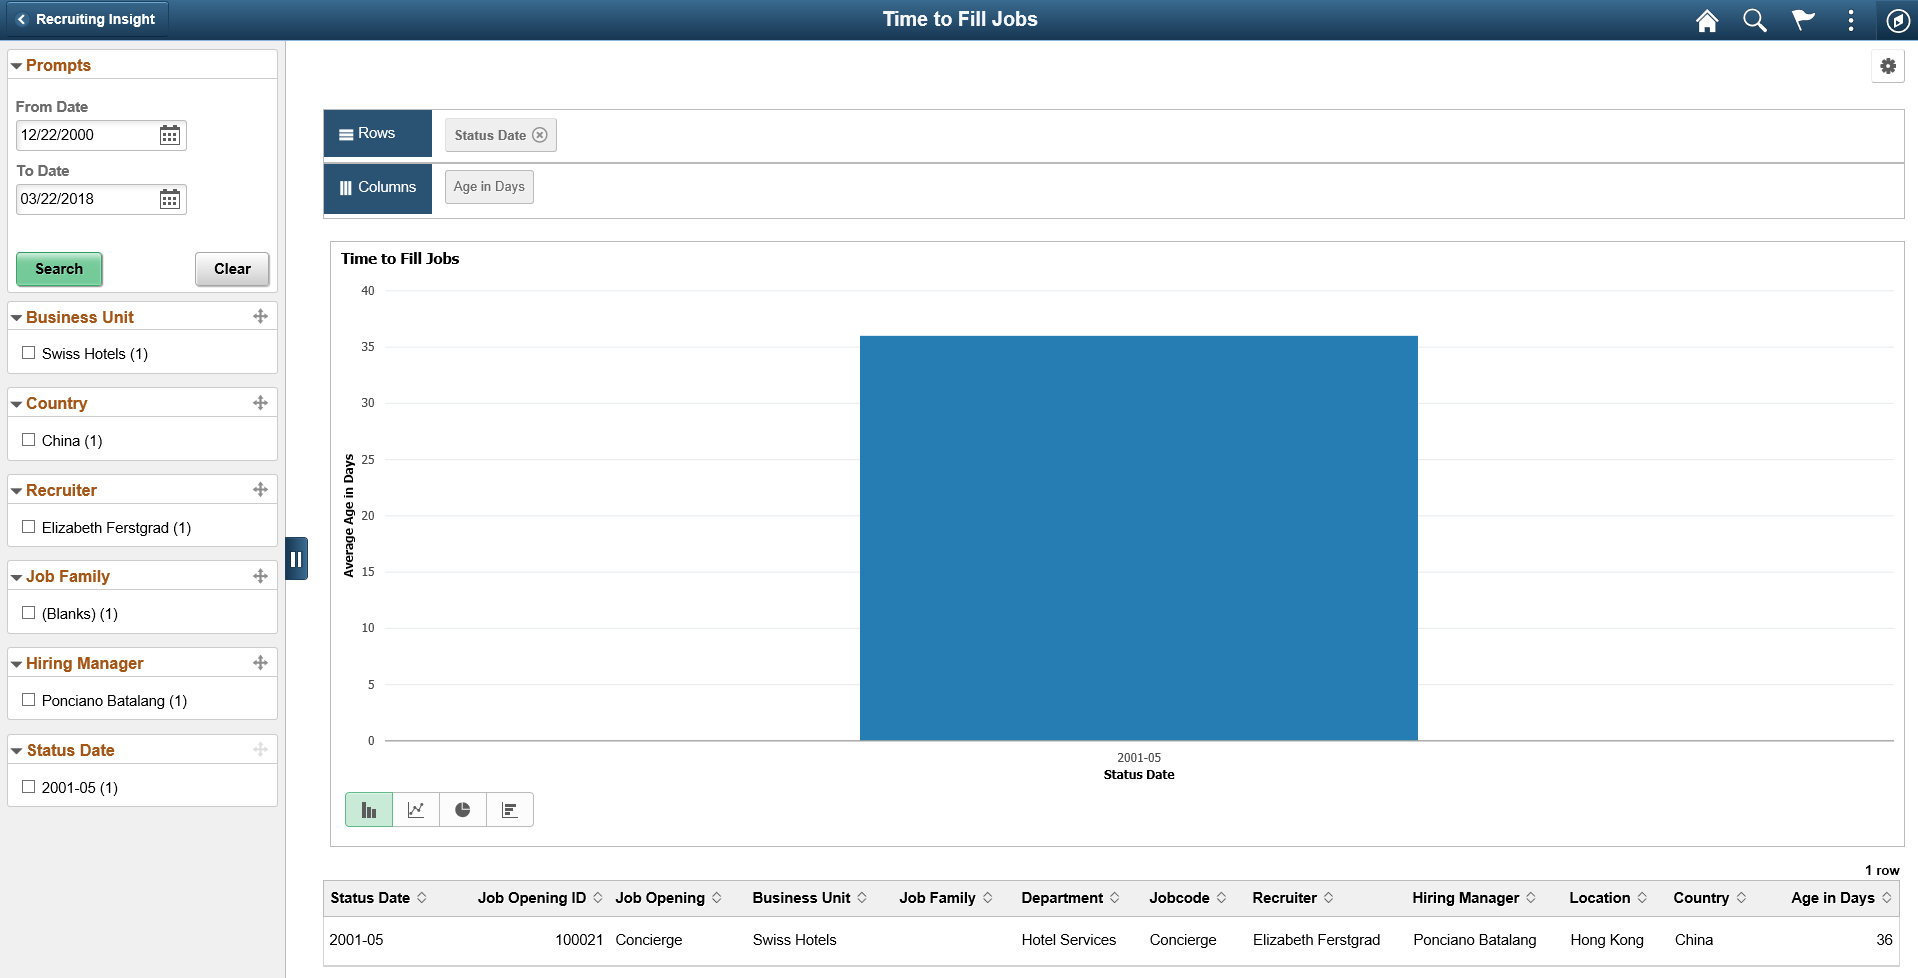
The Time to Fill pivot grid displays the average days taken to fill the job openings that are closed in a particular month.
The chart represents data for job openings to which the user has security access.
Use the Job Opening Aging tile (cref for the tile is HC_HRS_PG_J_AG_MY_ANALYTICS_FL) to view the number of open job openings of various ages.
Navigation:
Click the Recruiting Insight tile on Fluid Recruiting Homepage. The Job Opening Aging tile is on the Recruiting Insight home page.
This example illustrates the Job Opening Aging tile.
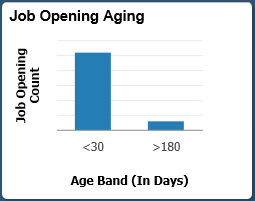
Click anywhere on the tile to access the Job Opening Aging pivot grid.
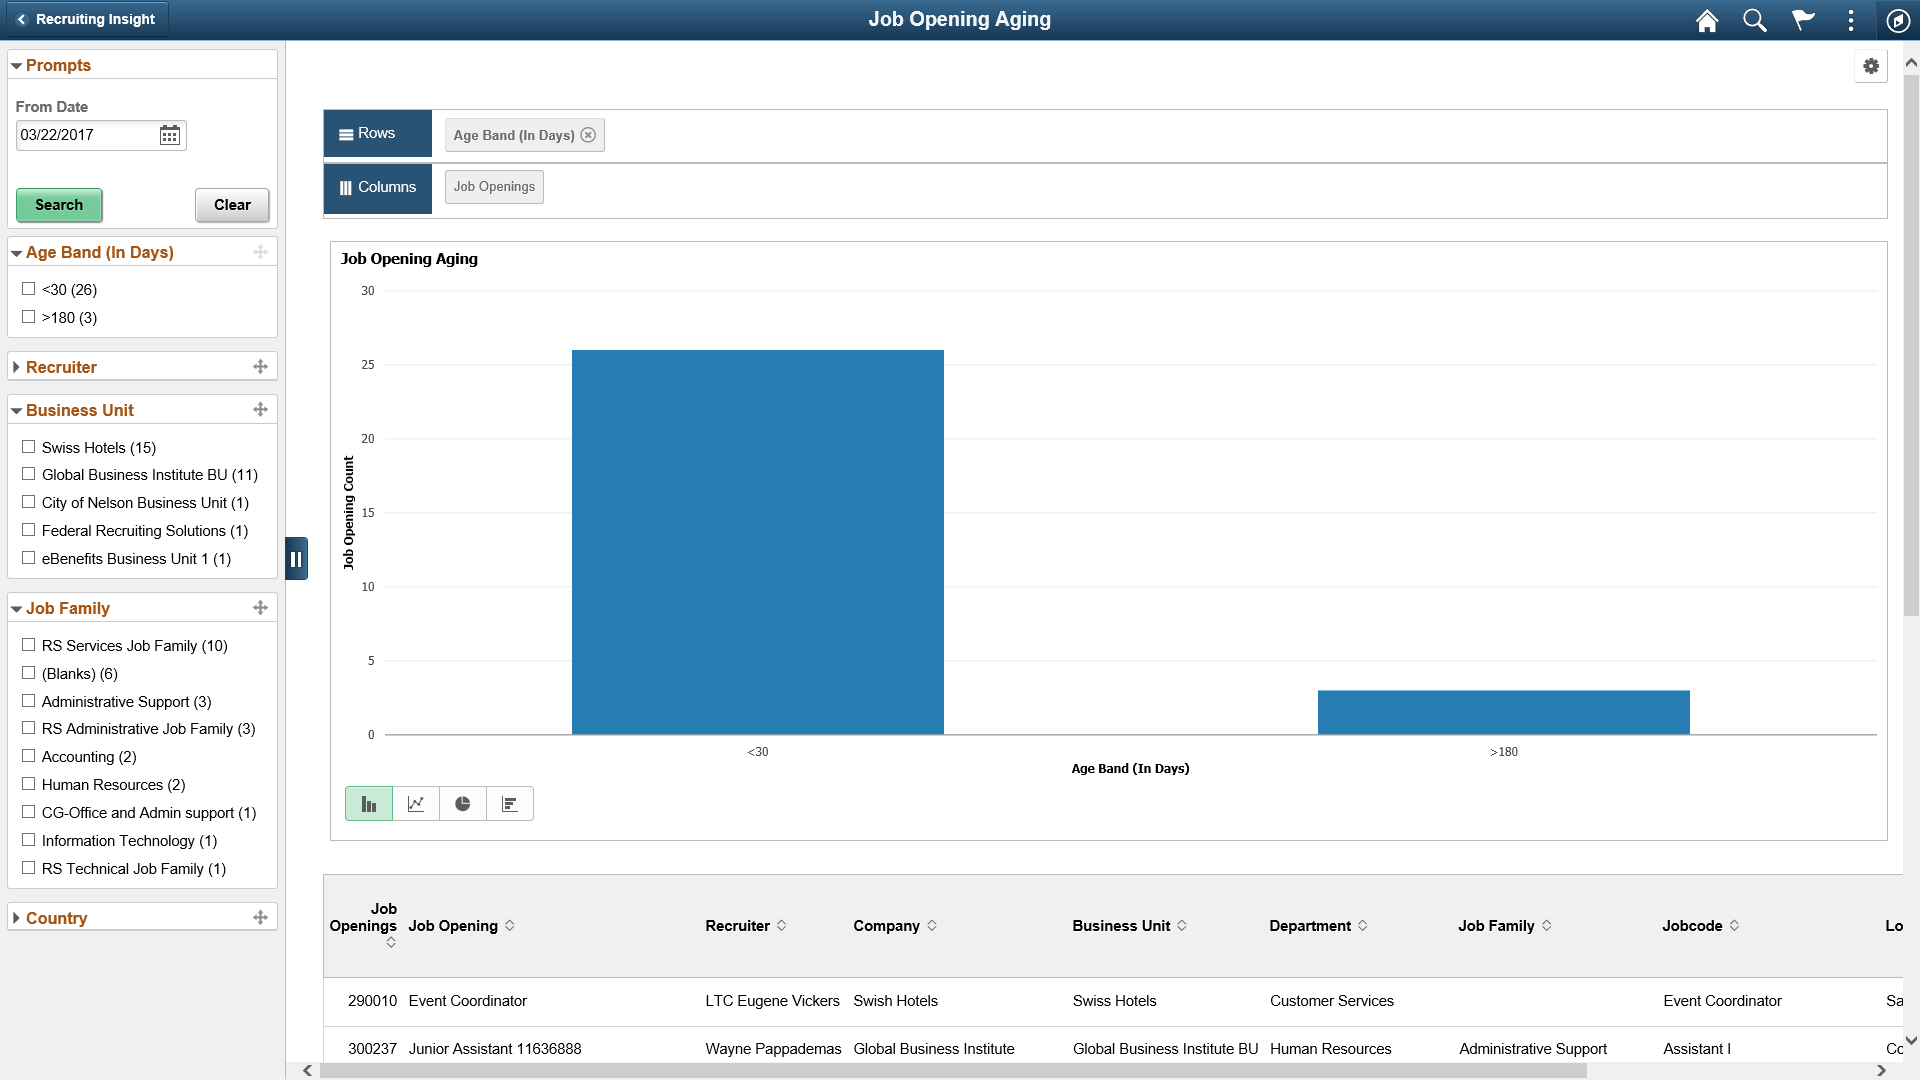
Use the Job Opening Aging pivot grid to view the number of open job openings of various ages.
Navigation:
Click the Job Opening Aging tile on the Recruiting Insight home page.
This example illustrates the Job Opening Aging pivot grid.
Use the In Process Applicants tile (cref for the tile is HC_HRS_PG_APP_MY_ANALYTICS_FL) to view the distribution of dispositions for applicants who are being considered for job openings.
Navigation:
Click the Recruiting Insight tile on Fluid Recruiting Homepage. The In Process Applicants tile is on the Recruiting Insight home page.
This example illustrates the In Process Applicants tile.
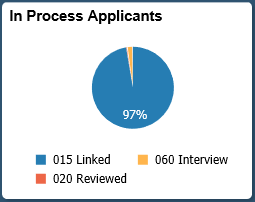
Click anywhere on the tile to access the In Process Applicants pivot grid.
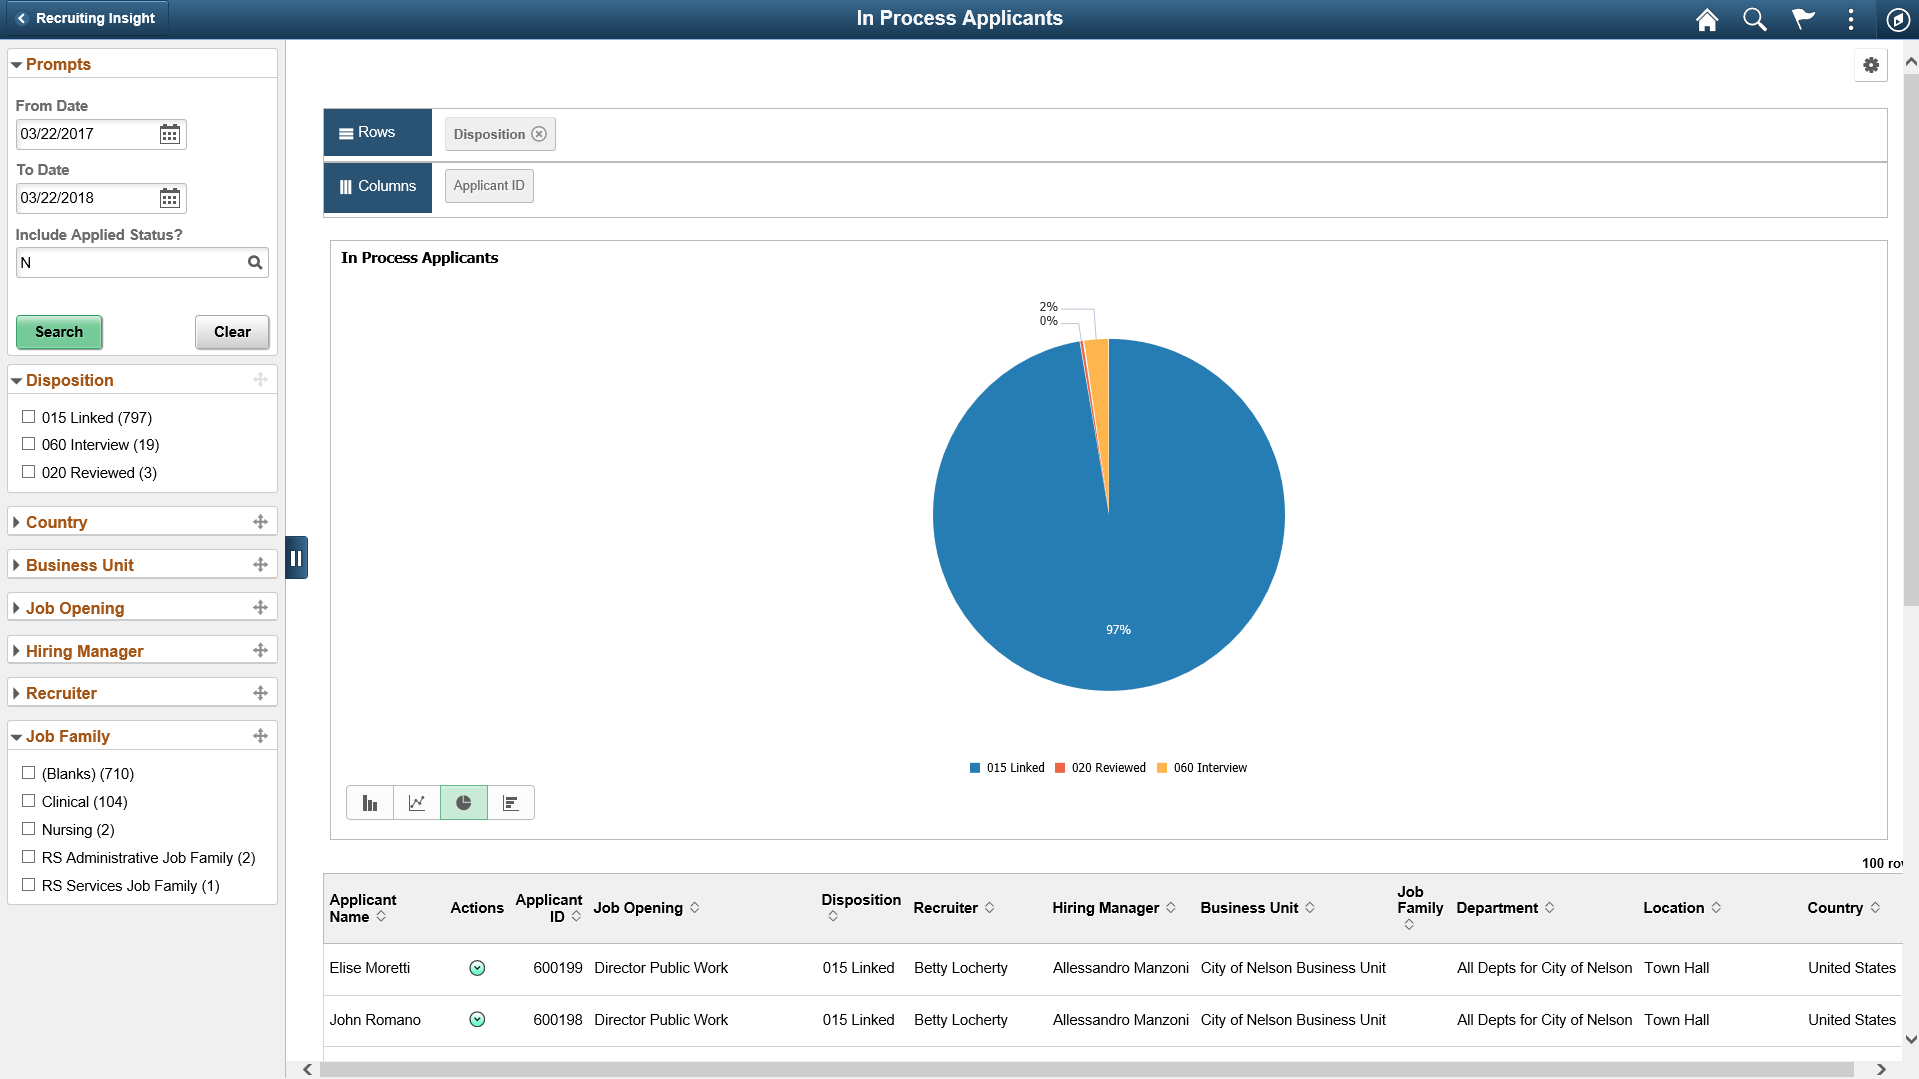
Use the In Process Applicants pivot grid to view a bar graph showing the user’s average number of days to fill a job opening for a specified time period.
Navigation:
Click the In Process Applicants tile on the Recruiting Insight home page.
This example illustrates the In Process Applicants pivot grid.
Use the Jobs Opened/Closed tile (cref for the tile is HC_HRS_PG_JO_OC_FL) to view a bar graph showing the user’s average number of days to fill a job opening for a specified time period.
Navigation:
Click the Recruiting Insight tile on Fluid Recruiting Homepage. The Jobs Opened/Closed tile is on the Recruiting Insight home page.
This example illustrates the Jobs Opened/Closed tile.
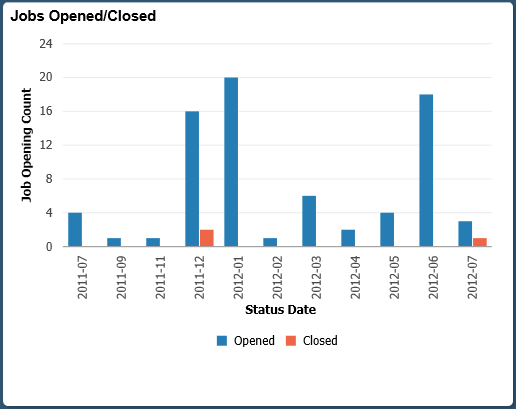
Click anywhere on the tile to access the Jobs Opened/Closed pivot grid.
Use the Jobs Opened/Closed pivot grid to view a bar graph showing the user’s average number of days to fill a job opening for a specified time period.
Navigation:
Click the Jobs Opened/Closed tile on the Recruiting Insight home page.
This example illustrates the Jobs Opened/Closed pivot grid.
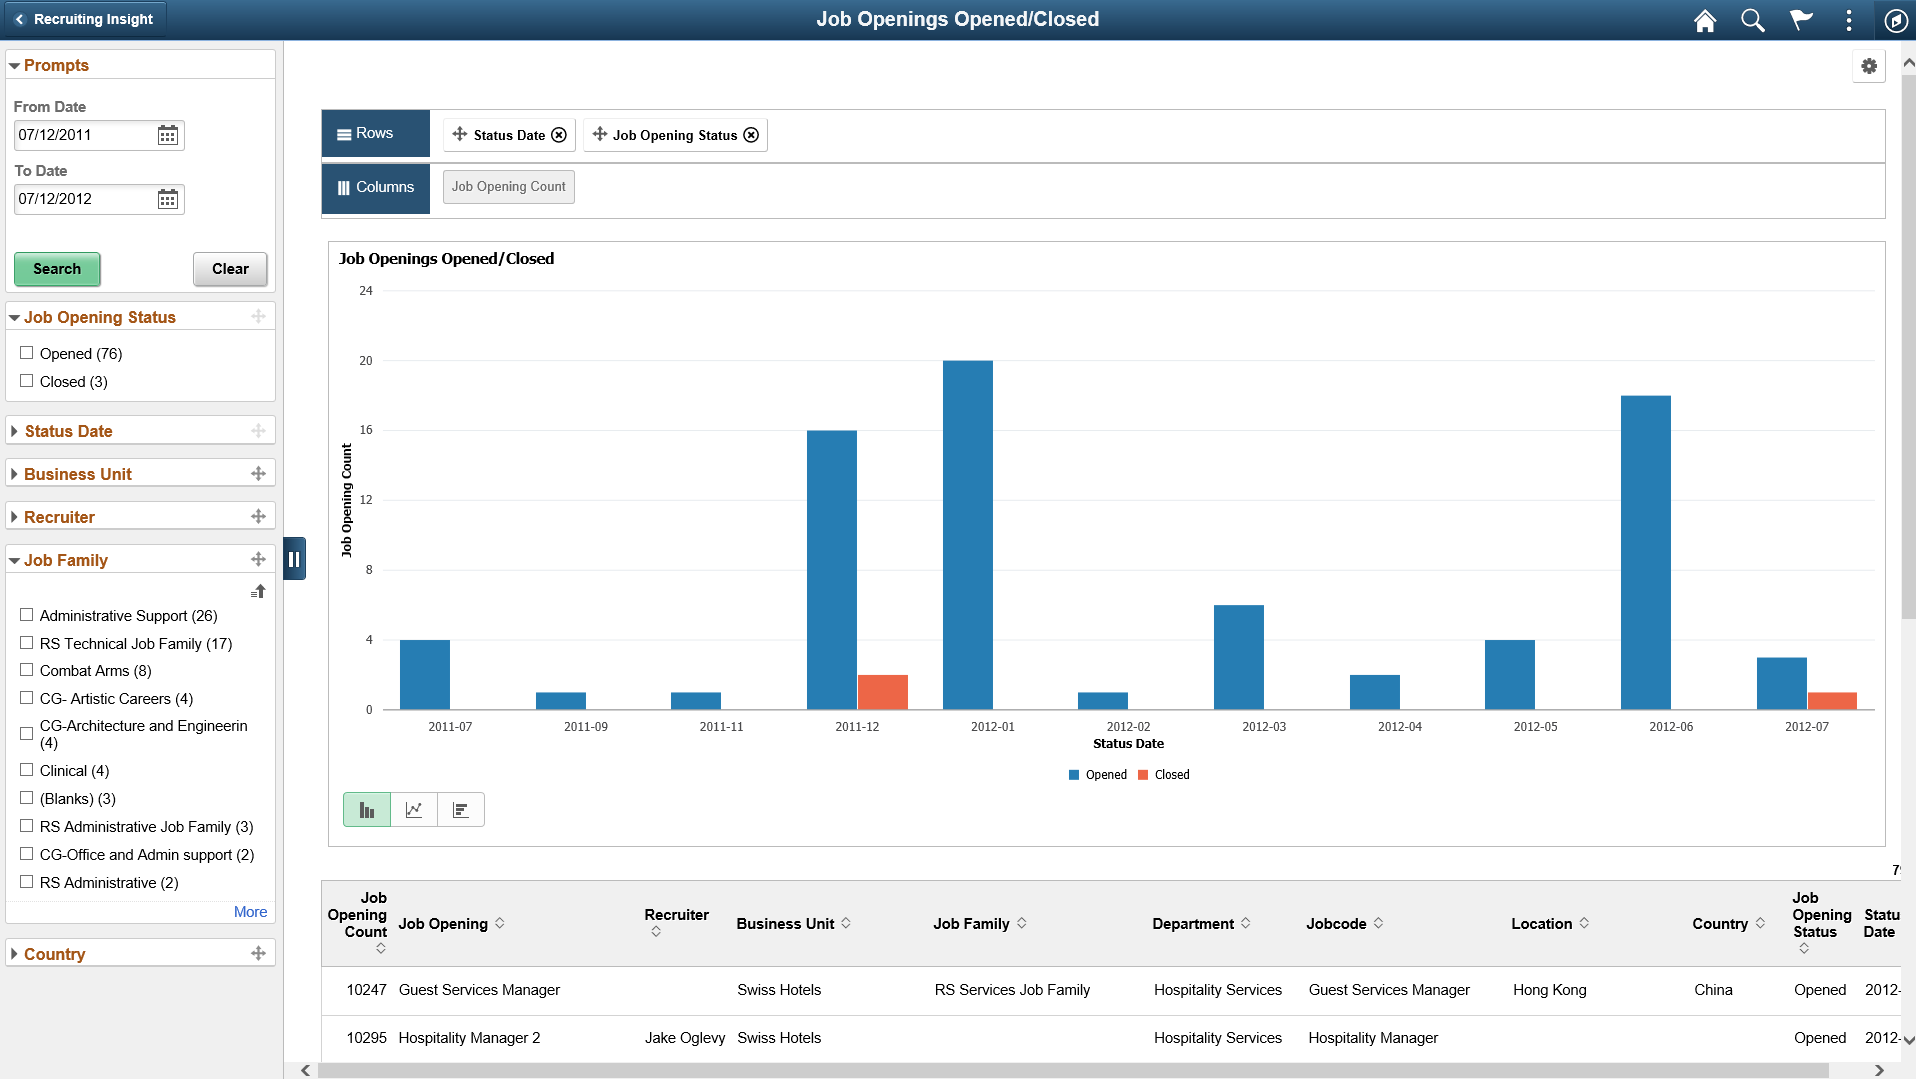
The Job Opened/Closed pivot grid displays monthly job opening data. By default, the data appears as a bar chart. For each month, one bar represents the number of job openings that were opened, and a second bar represent the number of job openings that were filled.
The opening date for a job opening is considered to be the earliest posting date or, if there are no postings defined, the actual job opening date. The closing date is the date that the job opening status changed to Filled/Closed.
The chart represents data for job openings to which the user has security access.
Use the Applicant Diversity tile (cref for the tile is HC_HRS_PG_DIV_OV_FL) to view diversity data by applicant.
Navigation:
Click the Recruiting Insight tile on Fluid Recruiting Homepage. The Applicant Diversity tile is on the Recruiting Insight dashboard.
This example illustrates the Applicant Diversity tile.
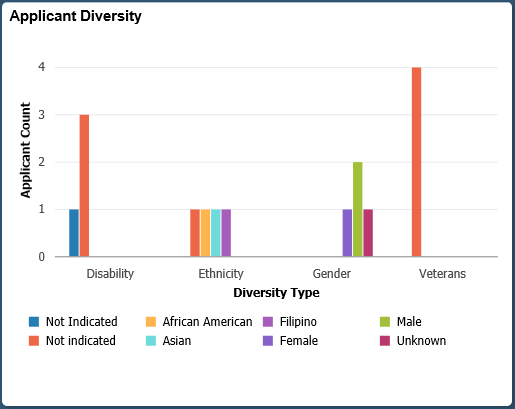
Click anywhere on the tile to access the Applicant Diversity pivot grid.
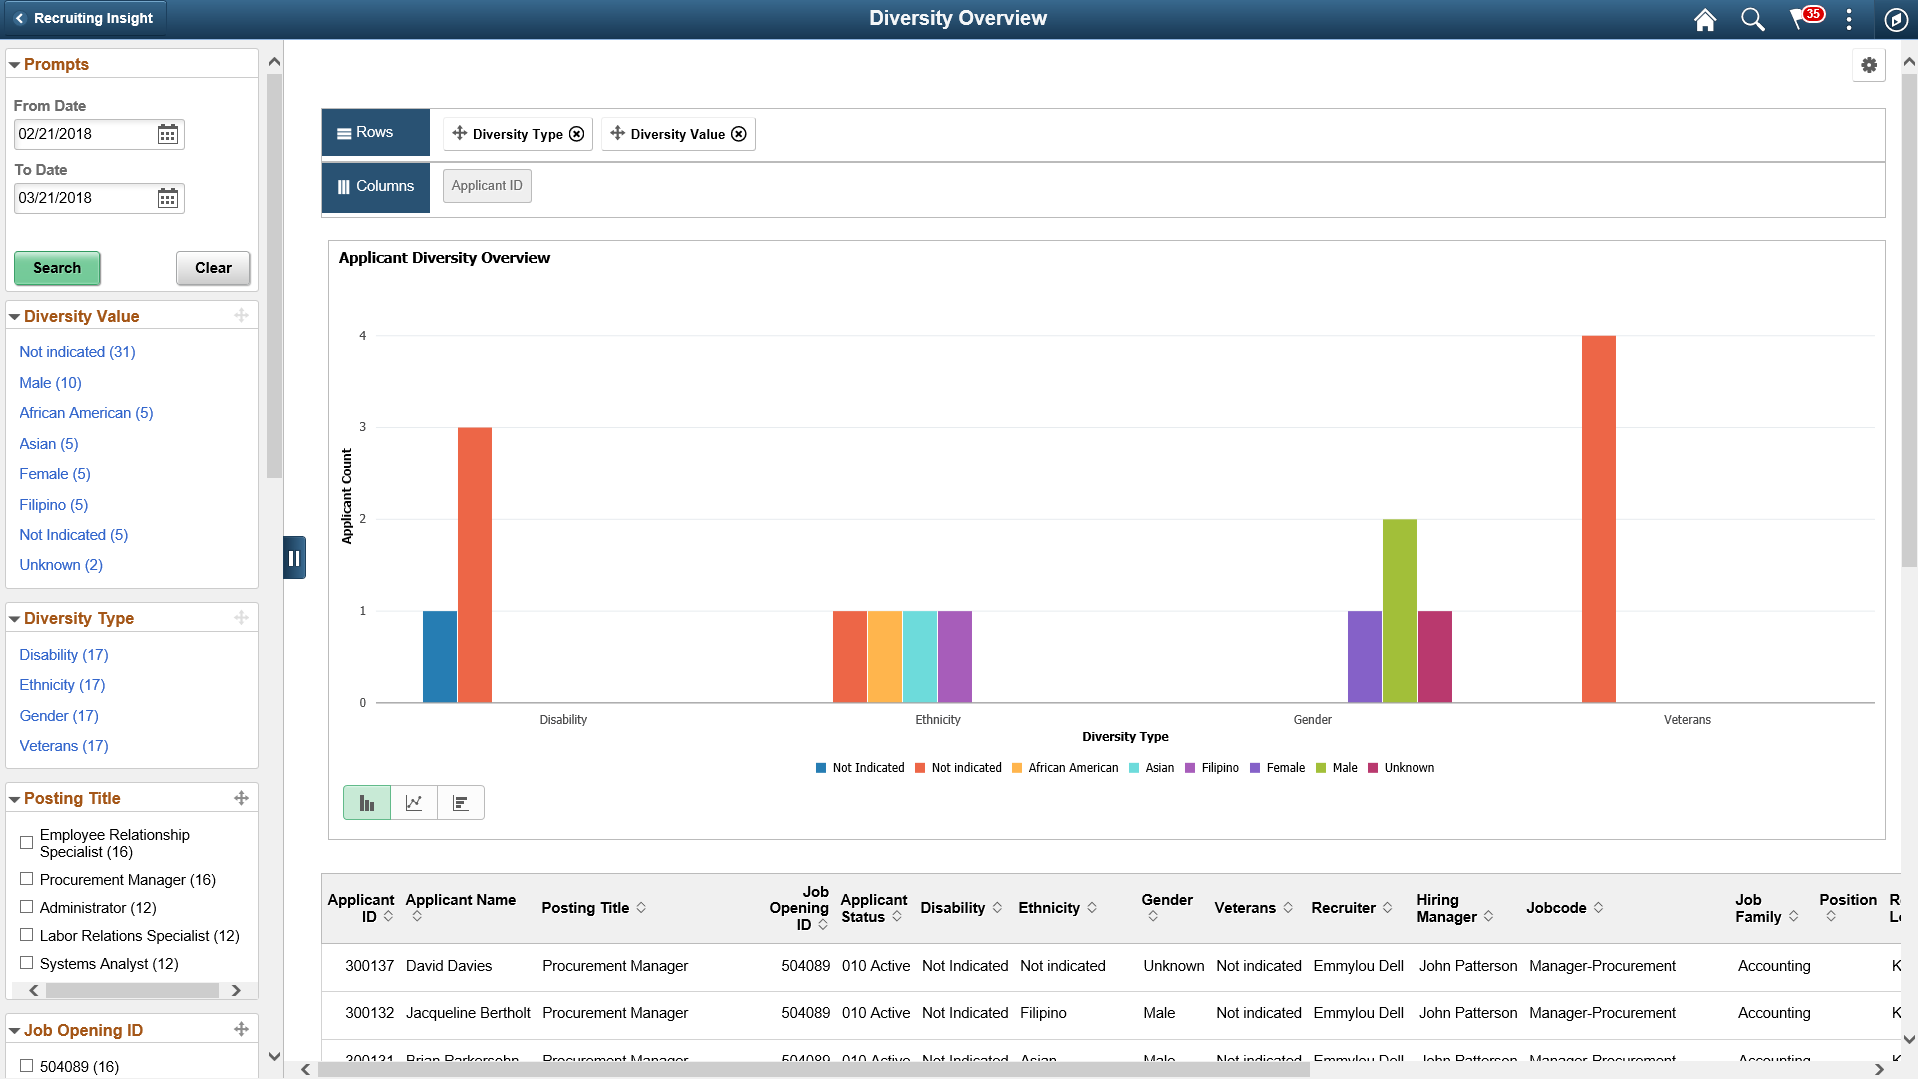
Use the Applicant Diversity Pivot grid to view diversity data by application.
Navigation:
Click the Applicant Diversity tile on the Recruiting Insight dashboard.
This example illustrates the Applicant Diversity Pivot pivot grid.
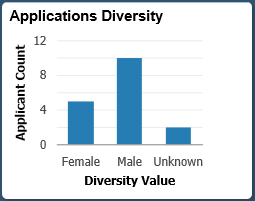
Use the Applications Diversity tile (cref for the tile is HC_HRS_PG_DA_APPLN_FL) to view diversity data by application.
Navigation:
Click the Recruiting Insight tile on Fluid Recruiting Homepage. The Applications Diversity tile is on the Recruiting Insight dashboard.
This example illustrates the Applications Diversity tile.
Click anywhere on the tile to access the Applications Diversity pivot grid.
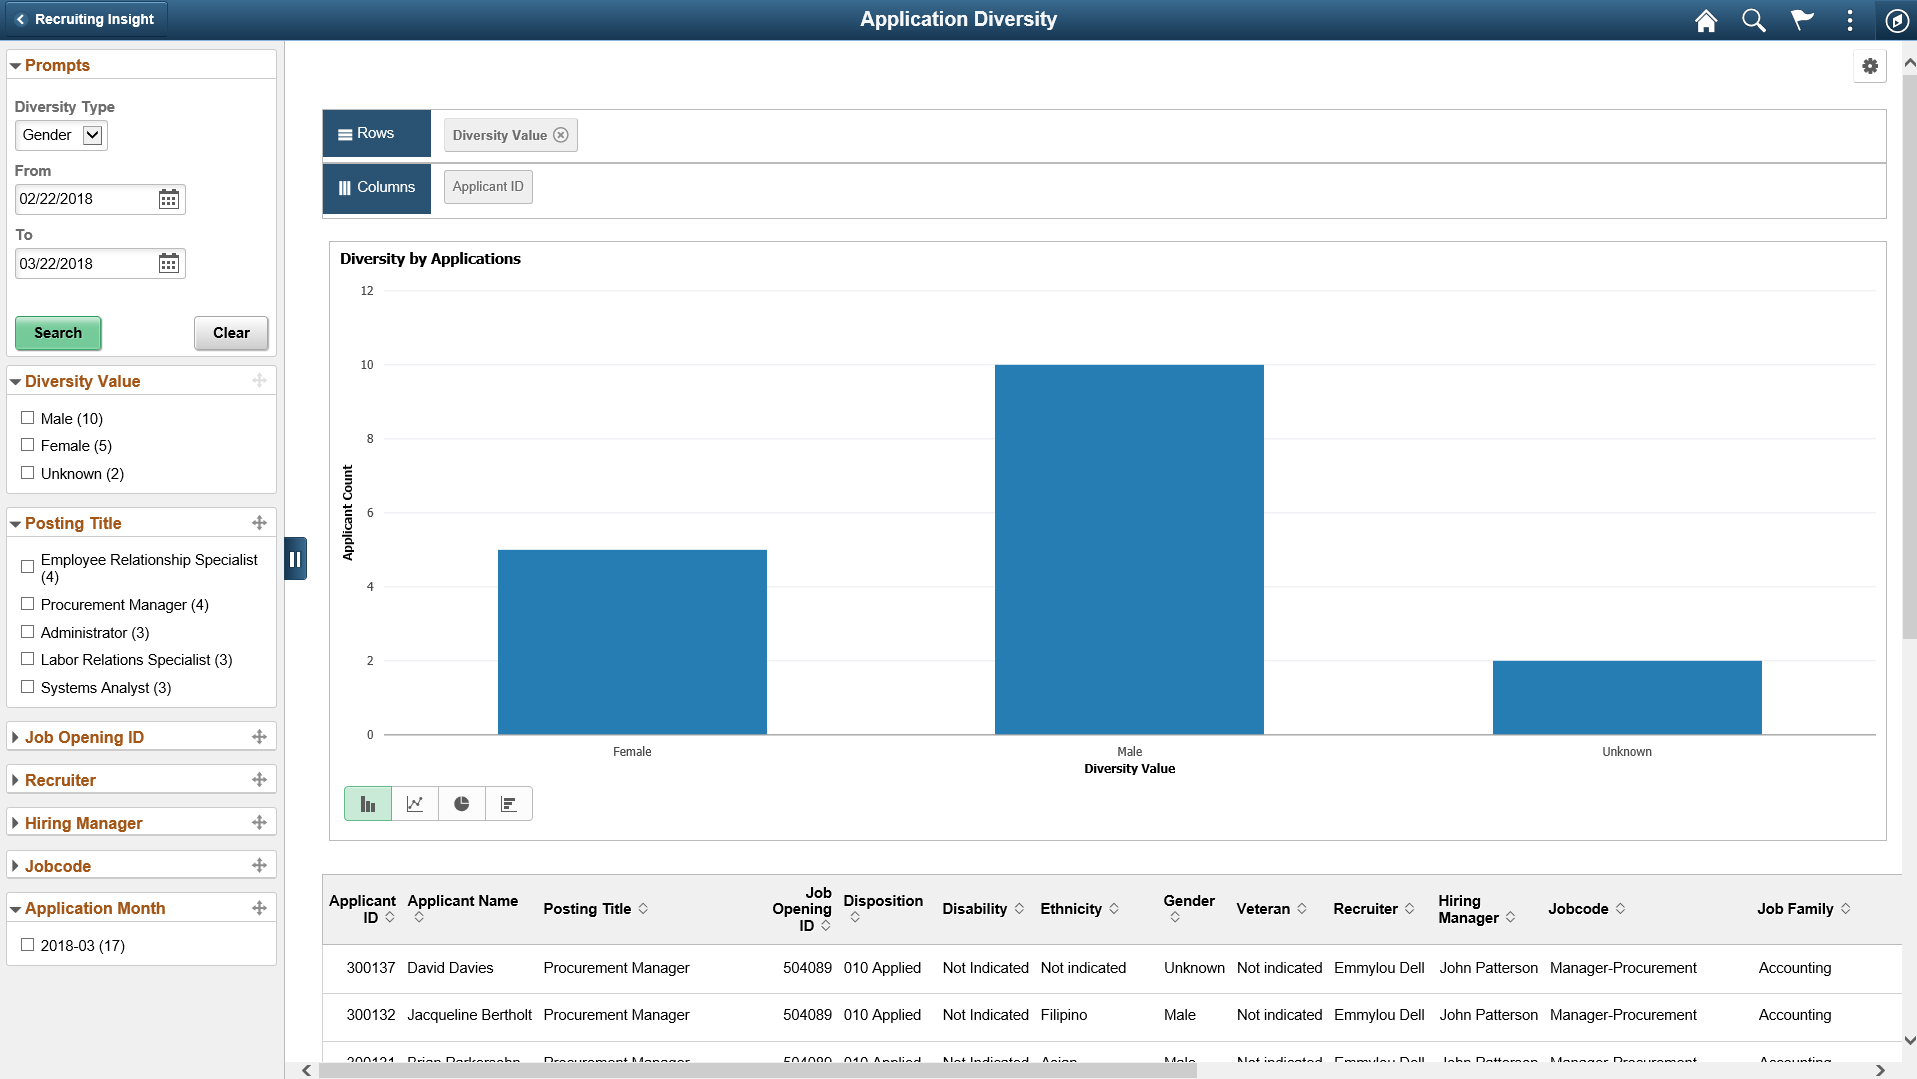
Use the Applications Diversity pivot grid to view diversity data by application.
Navigation:
Click the Applications Diversity tile on the Recruiting Insight dashboard.
This example illustrates the fields and controls on the Applications Diversity pivot grid.