Analyzing Asset Management Using PeopleSoft Insights
PeopleSoft Asset Management delivers two Insights dashboards that help users with business intelligence analytics. These dashboards are Asset Analytics and Year-Over-Year Asset Analytics.
|
Page Name |
Definition Name |
Usage |
|---|---|---|
|
Analyze asset count, cost, depreciation/amortization expense, and net book value based on asset type and category. |
||
|
Analyze year-over-year comparisons of asset acquisitions, disposals, depreciation/amortization expense, and cost versus net book value. |
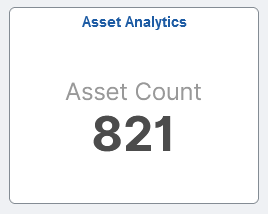
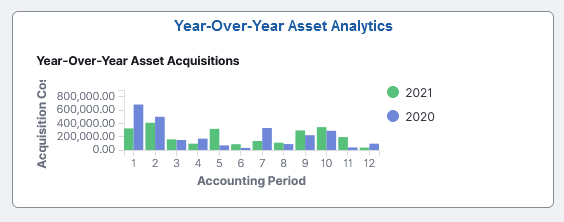
To access Asset Management Insights Dashboards, add these tiles to any Fluid homepage:
This example illustrates the Asset Analytics tile
This example illustrates the Year-Over-Year Asset Analytics tile
For more information about how to add a tile to a PeopleSoft Fluid Home page, see:
‘Working with the Fluid User Interface’ in the PeopleTools Accessibility Guide.
‘Working with Fluid Homepages and Dashboards’ in the PeopleTools Applications User’s Guide.
For more information about PeopleSoft delivered Insights dashboards, definitions, privileges, and roles, see Understanding PeopleSoft Insights Using PeopleSoft Search Framework
Use the Asset Analytics dashboard to analyze asset count, cost, depreciation/amortization expense, and net book value based on asset type and category.
Navigation:
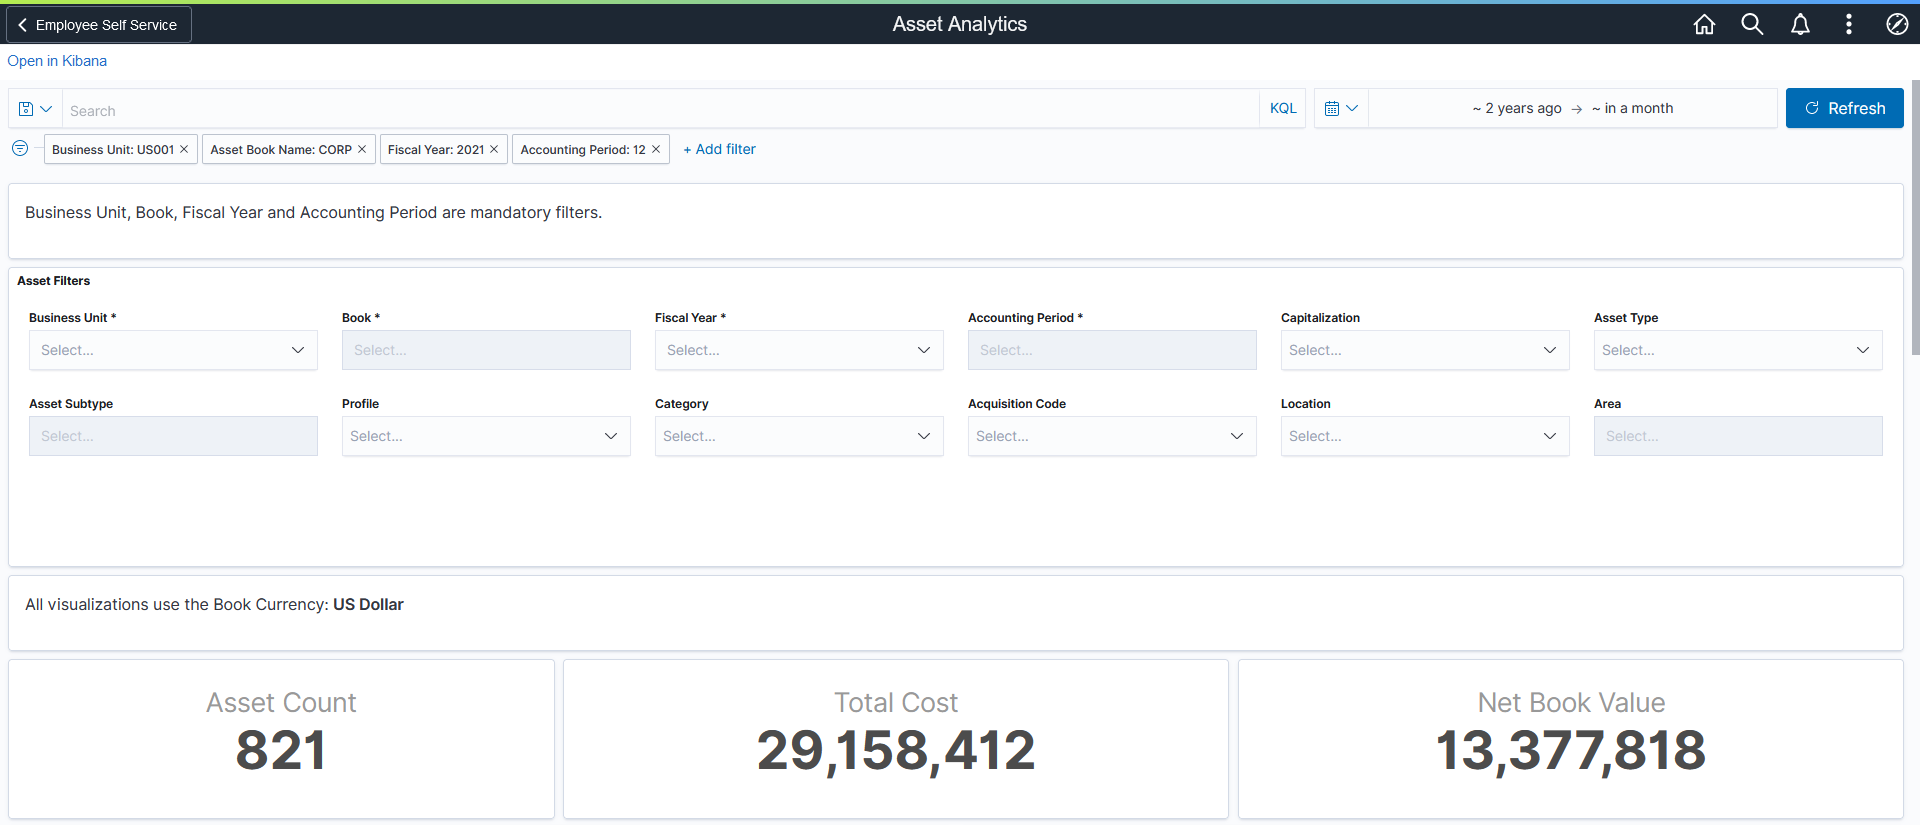
This example illustrates the fields and controls on the Asset Analytics Dashboard (1 of 3)
This example illustrates the fields and controls on the Asset Analytics Dashboard (2 of 3)
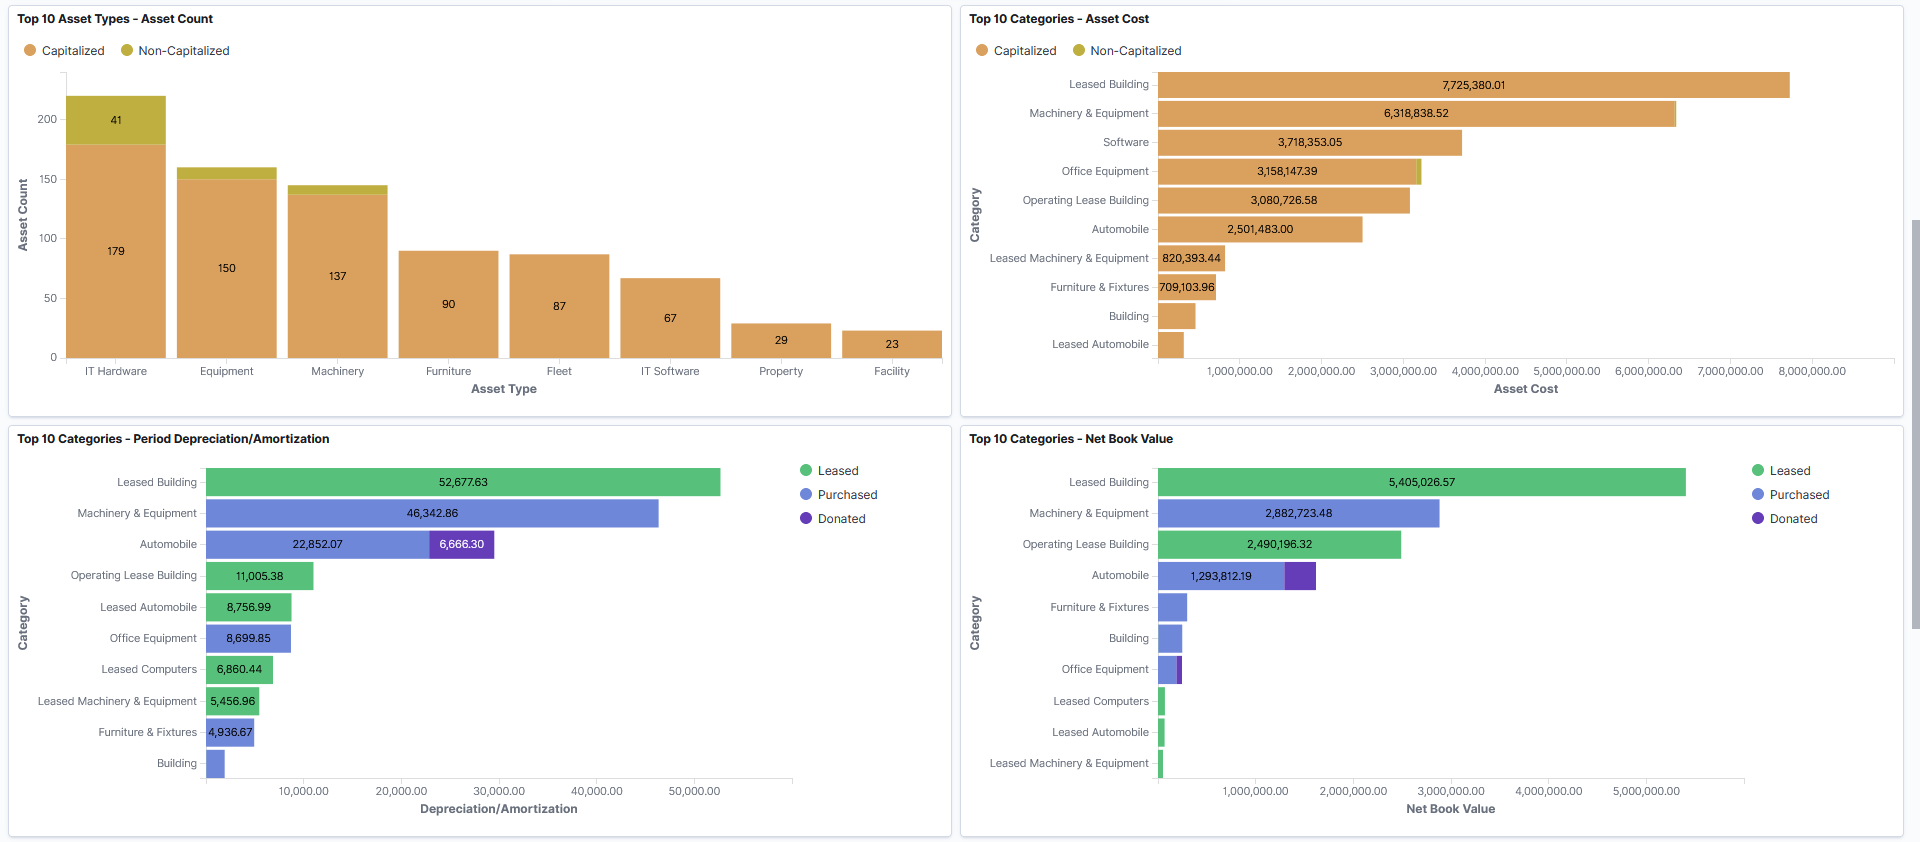
This example illustrates the fields and controls on the Asset Analytics Dashboard (3 of 3)
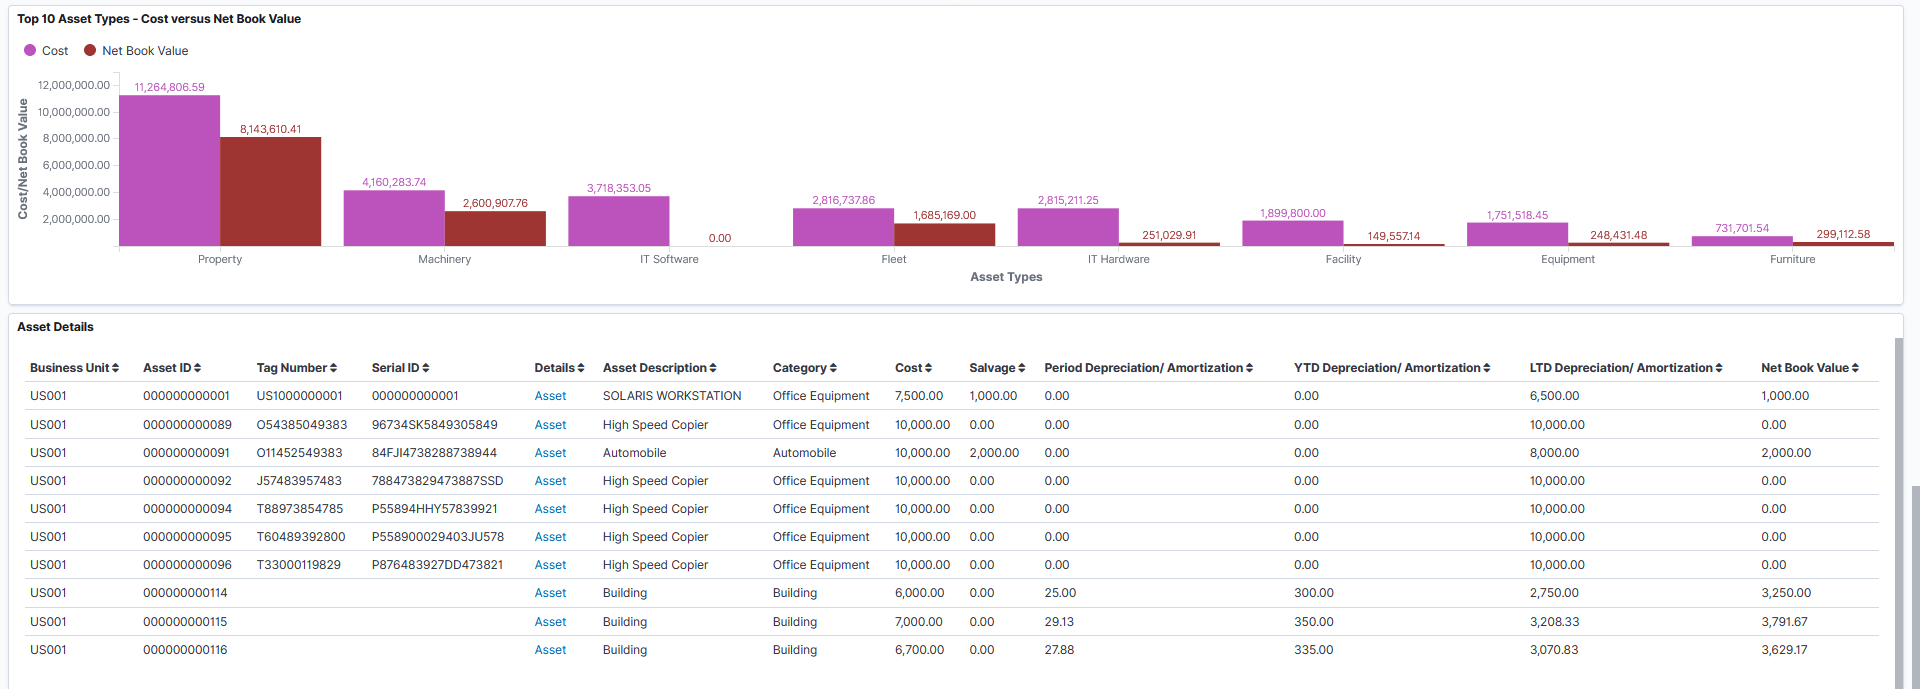
The visualizations and data displayed on the Asset Analytics dashboard are based on values selected for the Business Unit, Book, Fiscal Year, and Accounting Period filters, which are required. You can specify default Business Unit and Book values using the Insights Reporting Preferences section of the Asset Management - User Preferences Page. Fiscal Year and Accounting Period values are based on the calendar for the selected business unit and book, and the current system date. You can override all of the aforementioned filter values at any time.
You can further filter visualizations and data based on additional delivered filters, such as Capitalization, Profile (Asset Profile), and more.
Data can also be filtered by selecting any categorical data within a visualization (for example, an individual bar in a bar graph).
The following visualizations are part of this dashboard:
Asset Count: Provides count of total assets (capitalized and non-capitalzed).
Total Cost: Provides a snapshot of total asset cost (capitalized and non-capitalized).
Net Book Value: Provides a snapshot of total net book value of your assets.
Top 10 Asset Types - Asset Count: Provides an analysis of the top ten asset types that represent the total asset count. Each stacked bar provides a part-to-whole comparison of capitalized and non-capitalized assets.
Top 10 Categories - Asset Cost: Provides an analysis of the top ten asset categories with the highest asset cost. The stacked bar chart displays a part-to-whole comparison of capitalized and non-capitalized asset cost.
Top 10 Categories - Period Depreciation/Amortization: Provides an analysis of the top ten asset categories with the highest depreciation/amortization expense. The chart identifies depreciation/amortization expense by acquisition code.
Top 10 Categories - Net Book Value: Provides an analysis of the top ten asset categories with the highest net book value. The chart identifies net book value by acquisition code.
Top 10 Asset Types - Cost versus Net Book Value Provides a side-by-side comparison of cost and net book value for each of the top ten asset types.
Asset Details: Displays a list of assets making up the data shown in the visualizations. Use the Asset link to access the Printable View of Asset page and view further details about the asset.
Each visualization can be viewed separately in full screen. You can also drill down for more information using the Inspect option. That data can be downloaded as a comma separated value (CSV) file.
Use the Year-Over-Year Asset Analytics dashboard to analyze year-over-year comparisons of asset acquisitions, disposals, depreciation/amortization expense, and cost versus net book value.
Navigation:
This example illustrates the fields and controls on the Year-Over-Year Asset Analytics Dashboard (1 of 4)
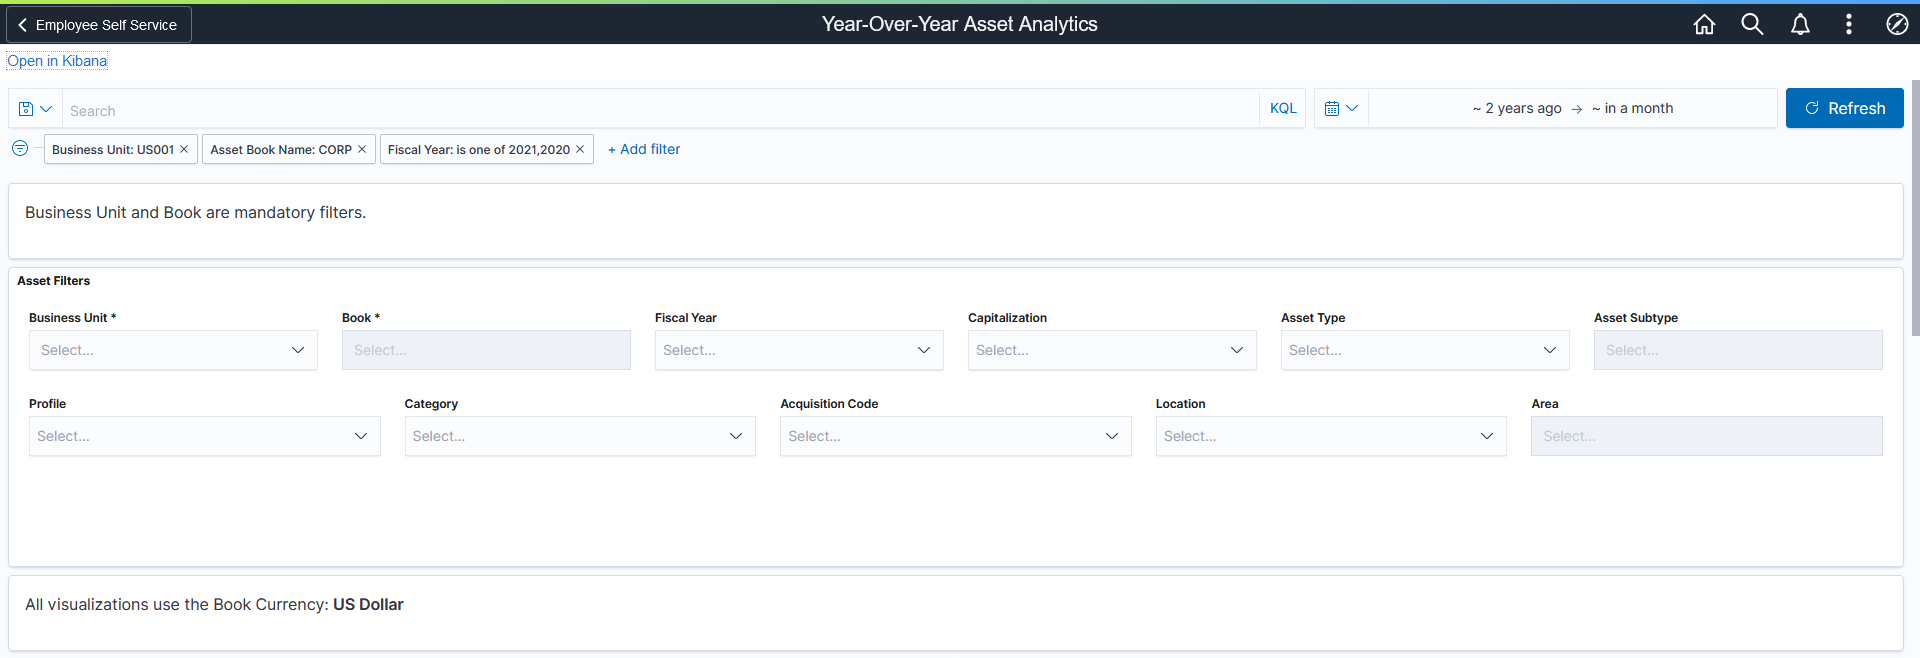
This example illustrates the fields and controls on the Year-Over-Year Asset Analytics Dashboard (2 of 4)
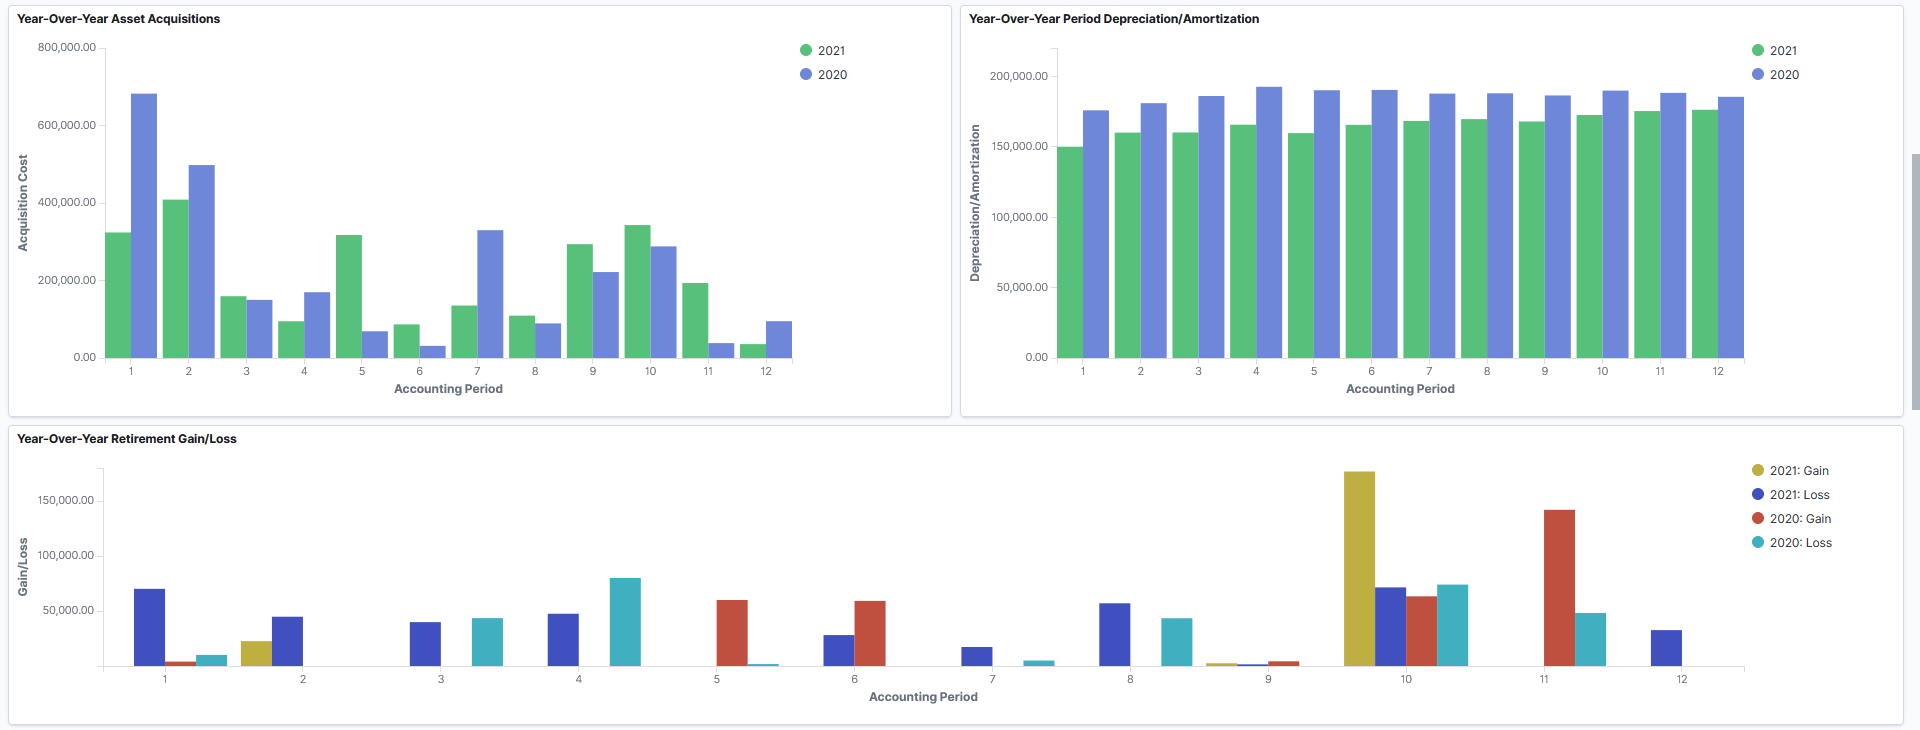
This example illustrates the fields and controls on the Year-Over-Year Asset Analytics Dashboard (3 of 4)
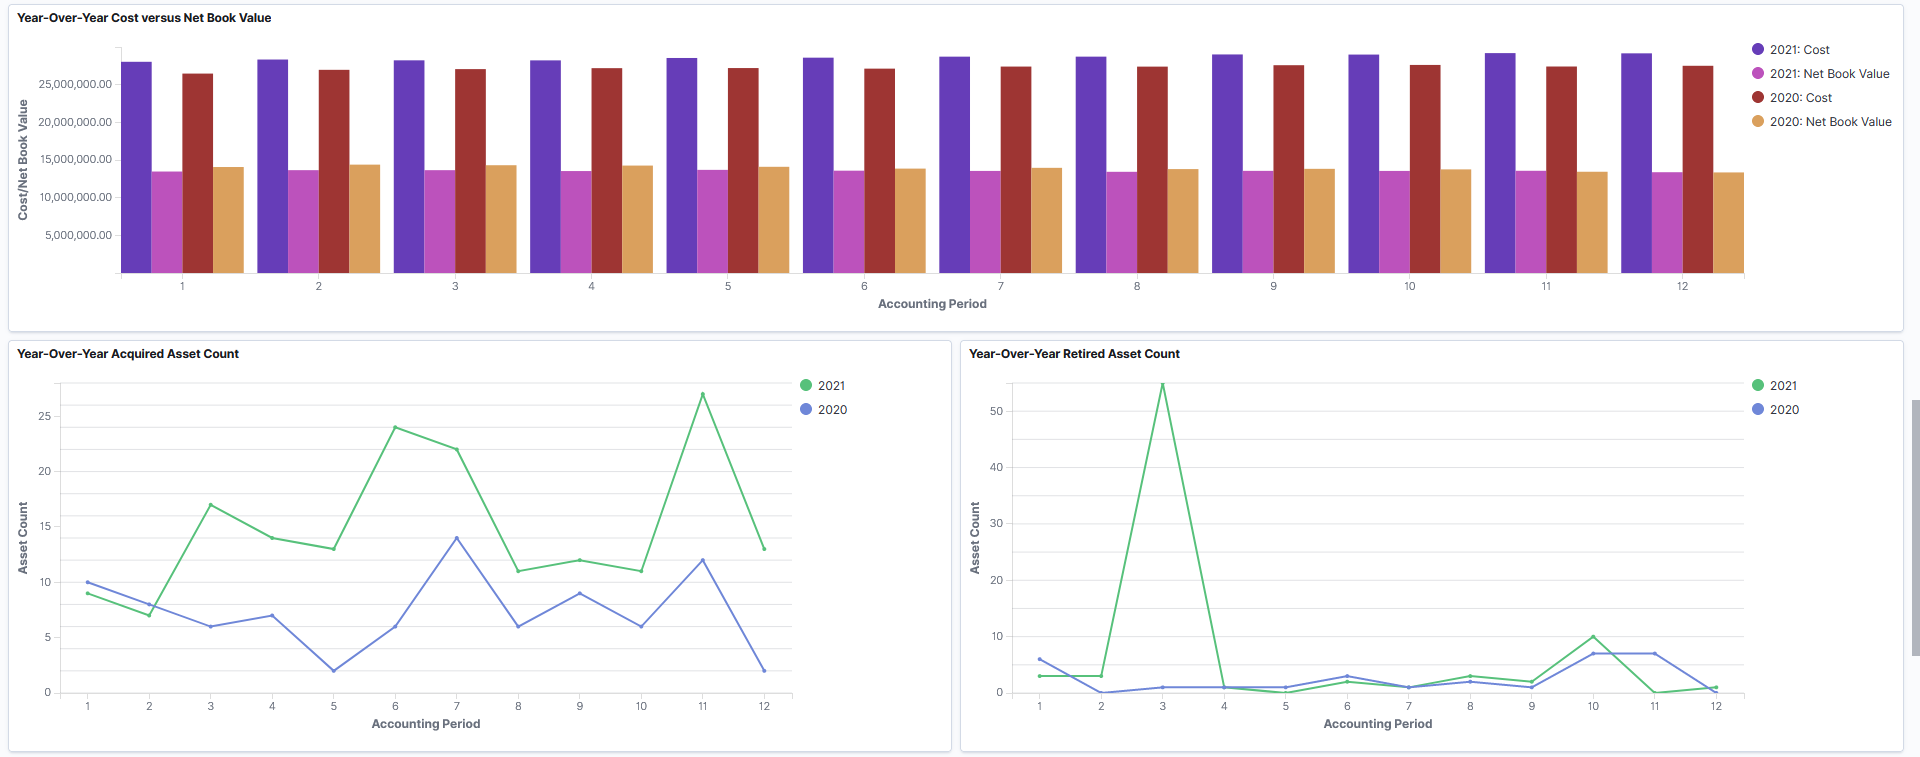
This example illustrates the fields and controls on the Year-Over-Year Asset Analytics Dashboard (4 of 4)

The visualizations and data displayed on the Asset Analytics dashboard are based on values selected for the Business Unit, and Book filters, which are required. You can specify default Business Unit and Book values using the Insights Reporting Preferences section of the Asset Management - User Preferences Page. Current and previous Fiscal Year values are based on the calendar for the selected business unit and book.You can override filter values at any time.
You can further filter visualizations and data based on additional delivered filters, such as Capitalization, Profile (Asset Profile), and more.
Data can also be filtered by selecting any categorical data within a visualization (for example, an individual bar in a bar graph).
The following visualizations are part of this dashboard:
Year-Over-Year Asset Acquisitions: Provides a year-over-year comparison of asset acquisitions by acquisition cost and accounting period. Assets included are financial and non-financial. The horizontal axis represents the accounting period, and the vertical axis represents acquisition cost.
Year-Over-Year Period Depreciation/Amortization: Provides a year-over-year comparison of asset depreciation and amortization by accounting period. The horizontal axis represents the accounting period, and the vertical axis represents the depreciation and amortization amount.
Year-Over-Year Retirement Gain/Loss: Provides a year-over-year comparison of asset retirement gain and loss, by accounting period. The horizontal axis represents the accounting period, and the vertical axis represents retirement gain or loss.
Year-Over-Year Cost Versus Net Book Value: Provides a year-over-year comparison of asset cost and net book value by accounting period The horizontal axis represents the accounting period, and the vertical axis represents asset cost and net book value.
Year-Over-Year Acquired Asset Count: Provides a year-over-year comparison of acquired asset count by accounting period. The horizontal axis represents the accounting period, and the vertical axis represents asset count.
Year-Over-Year Retired Asset Count: Provides a year-over-year comparison of retired asset count by accounting period. The horizontal axis represents the accounting period, and the vertical axis represents retired asset count.
Asset Details: Displays a list of assets making up the data shown in the visualizations. Use the Asset link to access the Printable View of Asset page and view further details about the asset.
Each visualization can be viewed separately in full screen. You can also drill down for more information using the Inspect option. That data can be downloaded as a CSV file.