Analyzing Receivables Using PeopleSoft Insights
PeopleSoft Receivables delivers four Insights dashboards that help users with business intelligence analytics. These dashboards are AR Collections Analysis, Collector Performance, Collector dashboard, and Collections Manager dashboard.
|
Page Name |
Definition Name |
Usage |
|---|---|---|
|
Monitor and measure your Receivables position. |
||
|
Analyze the collector’s workload and tasks assigned to them. |
||
|
Analyze aging and history activity by customer. |
||
|
Analyze aging and history activity across Receivables. |
To access Receivables Insights Dashboards, add these tiles to the Credit to Cash Operations Fluid homepage:
This example illustrates the AR Collection Analysis tile
This example illustrates the Collector Performance tile
This example illustrates the Collector Dashboard tile
This example illustrates the Collections Manager Dashboard tile
For more information about how to add a tile to a PeopleSoft Fluid Home page, see:
Working with the ‘Fluid User Interface’ in the PeopleTools Accessibility Guide.
Working with the ‘Working with Fluid Homepages and Dashboards’ in the PeopleTools Applications User’s Guide.
For more information about PeopleSoft delivered Insights dashboards, definitions, privileges, and roles, see Understanding PeopleSoft Insights Using PeopleSoft Search Framework
Use the AR Collections Analysis dashboard to monitor and measure your Receivables position.
This dashboard enables you to gain access to both basic and advanced data elements that helps you understand the current state of receivables and progress toward organizational goals.
Navigation:
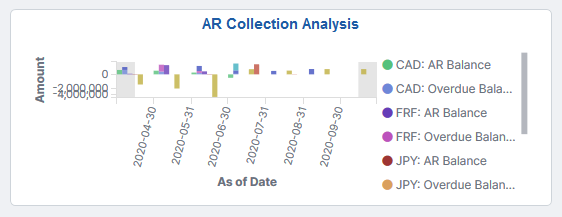
This example illustrates the fields and controls on the AR Collections Analysis dashboard.
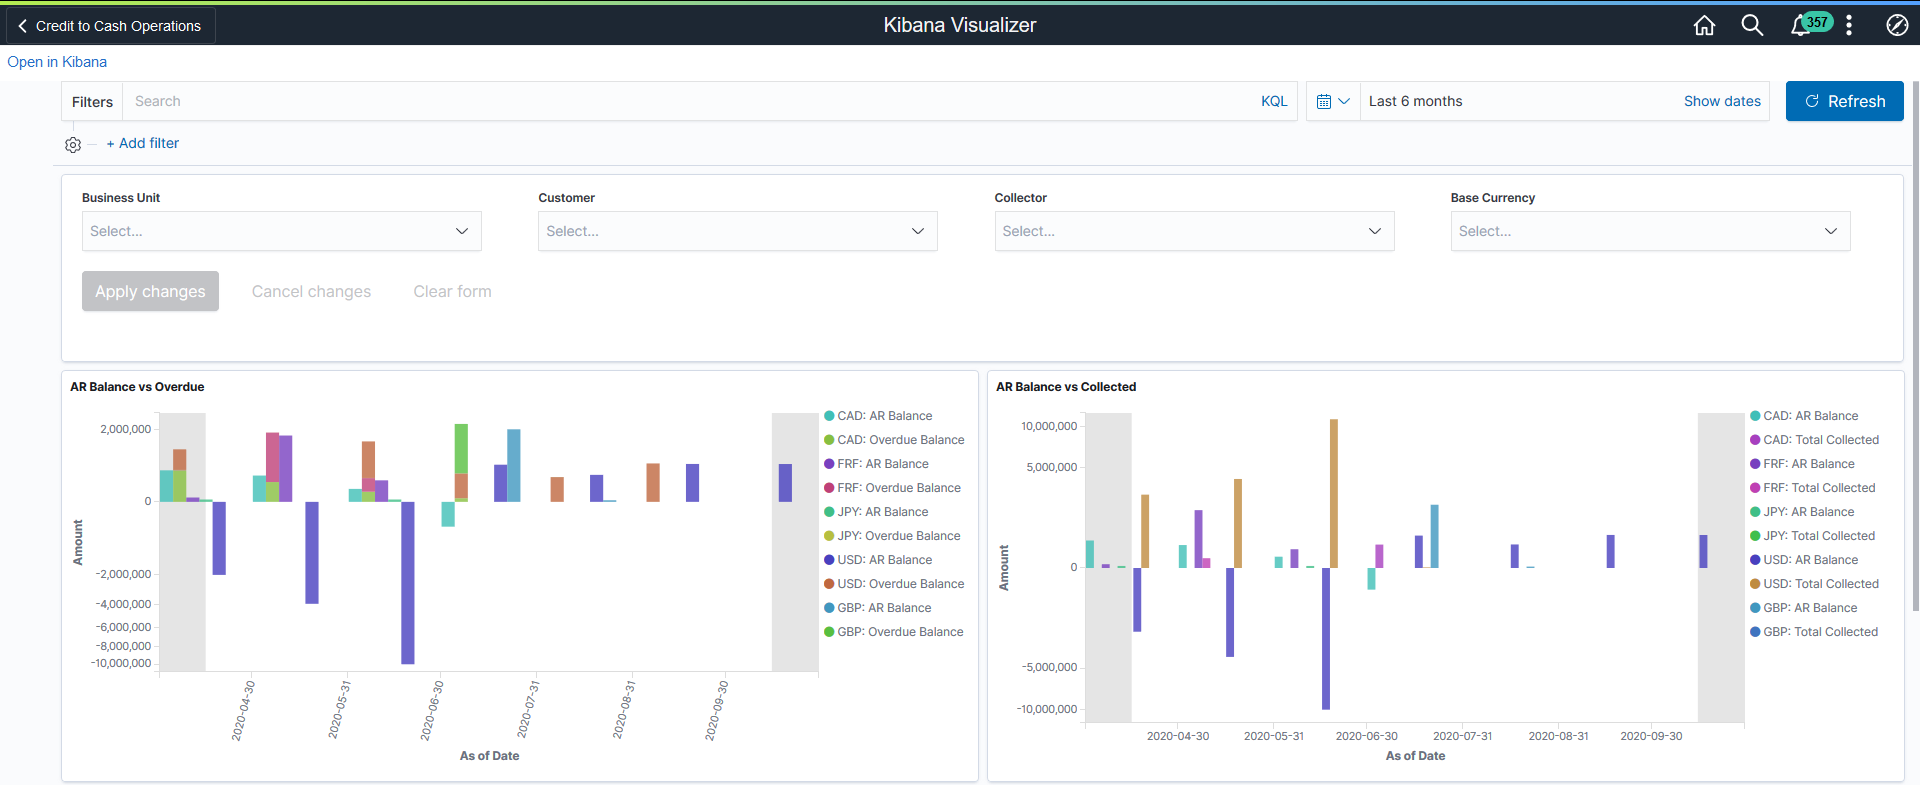
This example illustrates the fields and controls on the AR Collections Analysis dashboard.
This example illustrates the fields and controls on the AR Collections Analysis dashboard.
The visualizations and data displayed on the AR Collection Analysis dashboard can be filtered based on the delivered filters, such as Business Unit, Customer, Collector, and Base Currency. Multiple filter values can be selected. For example, you can select multiple business units from the Business Unit filter. Data can also be filtered by selecting any categorical data within a visualization (for example, an individual bar in a bar graph). In addition, you can search for available filters or add additional filters.
The following visualizations are part of this dashboard:
AR Balance vs Overdue: Provides an analysis of total receivables balance versus overdue balances.
AR Balance vs Collected: Provides an analysis of total receivables balance versus collected balances.
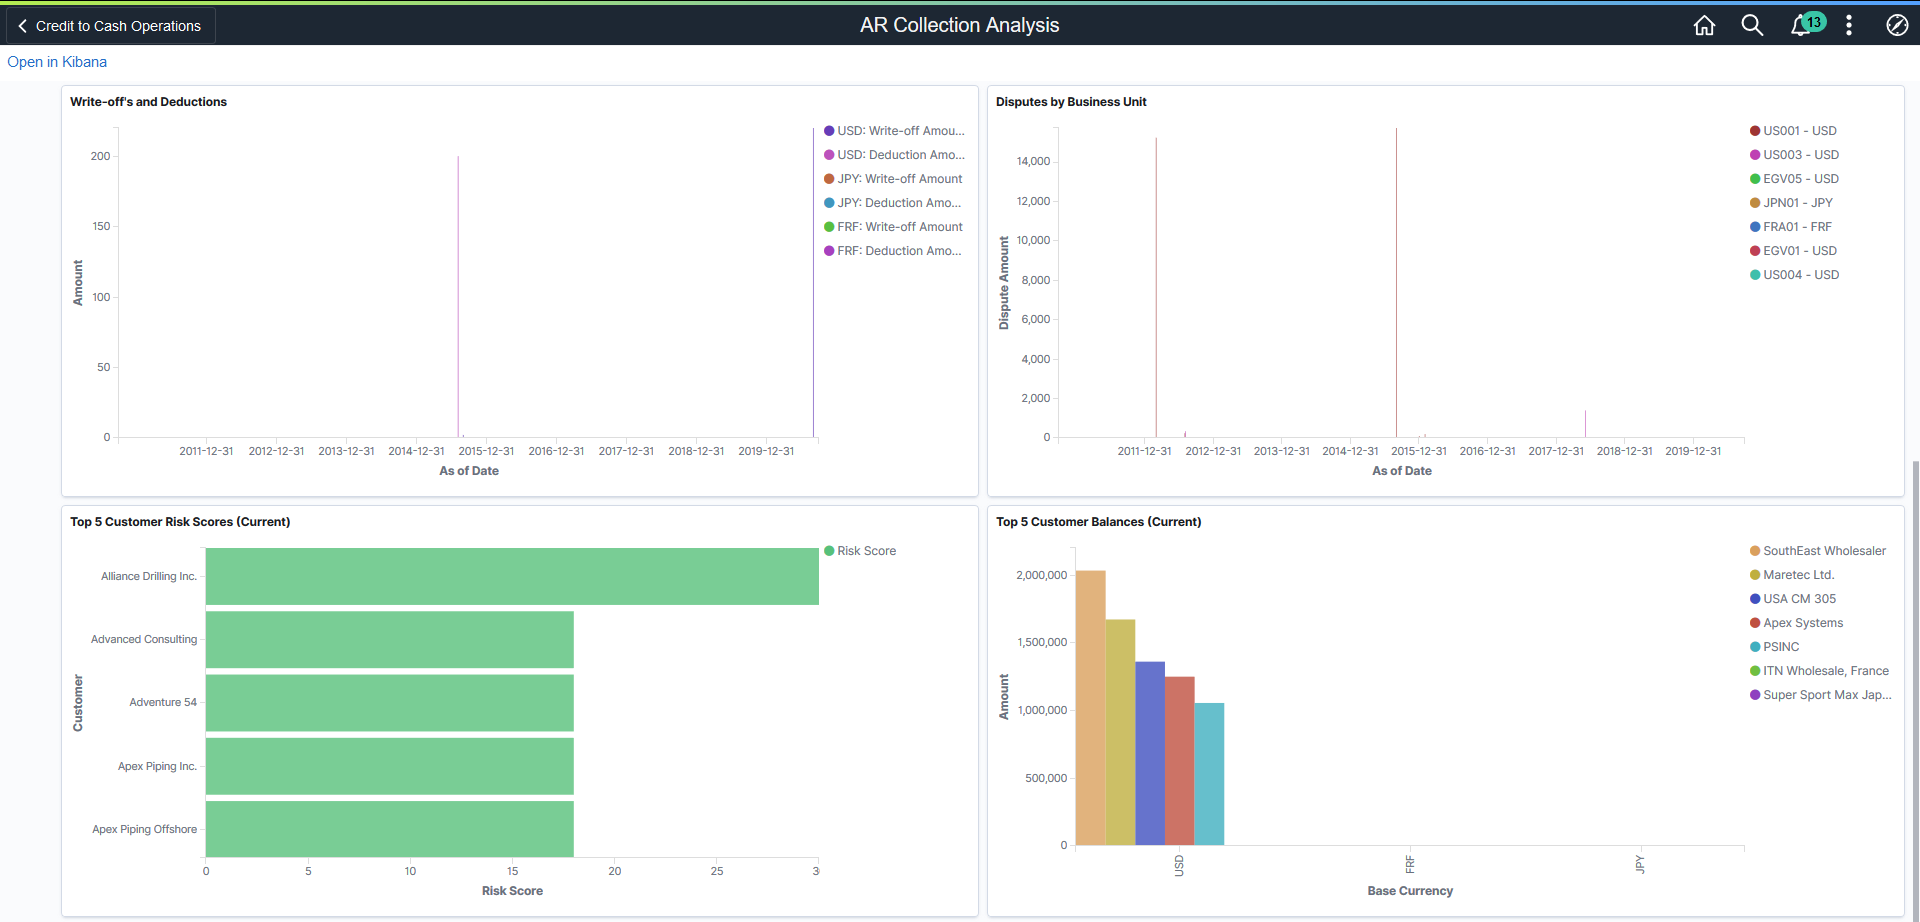
Write-Offs and Deductions: Provides an analysis of total write-off and deduction amounts.
Disputes by Business Unit: Provides an analysis of total disputes by business unit.
Top Five Customer Risk Scores: Provides an analysis of the top five customers with the highest risk scores.
Top Five Customer Balances: Provides an analysis of top five customers for highest balances owed.
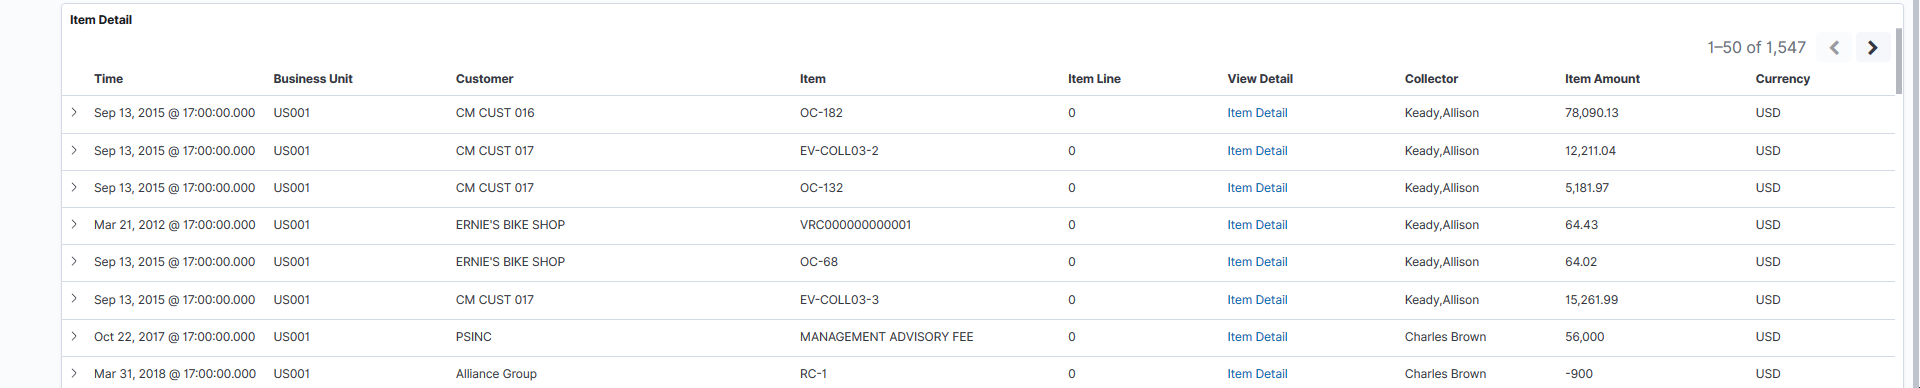
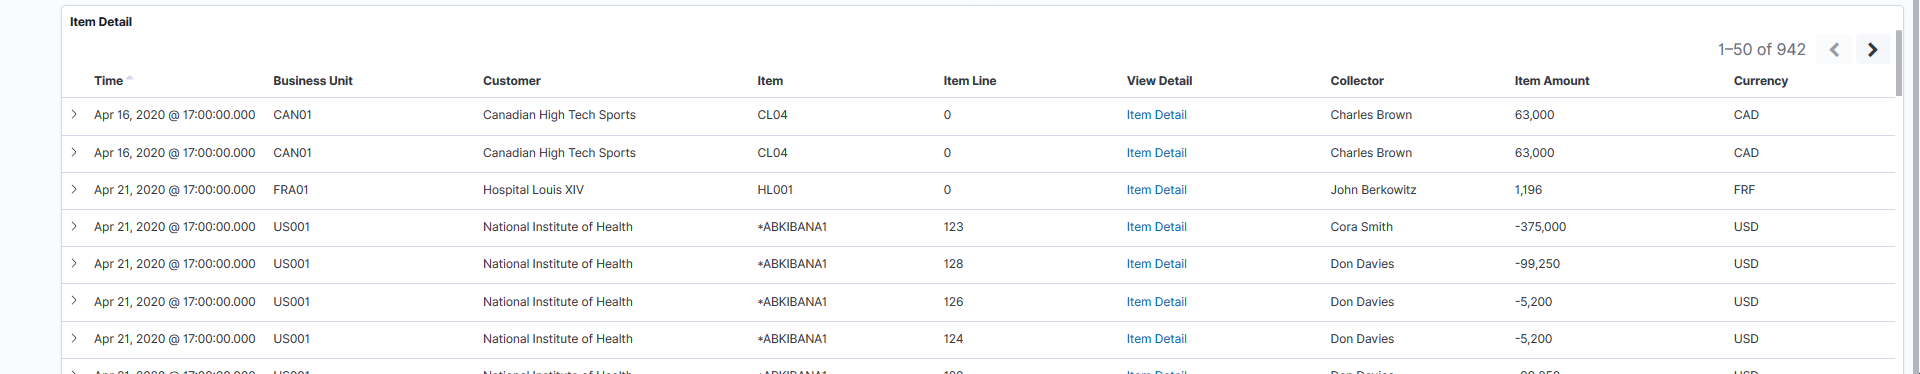
Item Detail: Displays a list of items making up the data shown in the visualizations. Use the Item Detail link to access the Item Activity Page and view further details about the item or modify information as needed.
Each visualization can be viewed separately in full screen. You can also drill down for more information using the Inspect option. That data can be downloaded as a CSV file.
Use the Collector Performance dashboard to analyze the collector’s workload and tasks assigned to them.
This dashboard enables you to ensure receivables are collected on a timely basis.
Navigation:
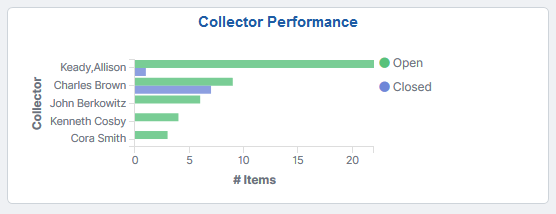
This example illustrates the fields and controls on the Collector Performance dashboard.
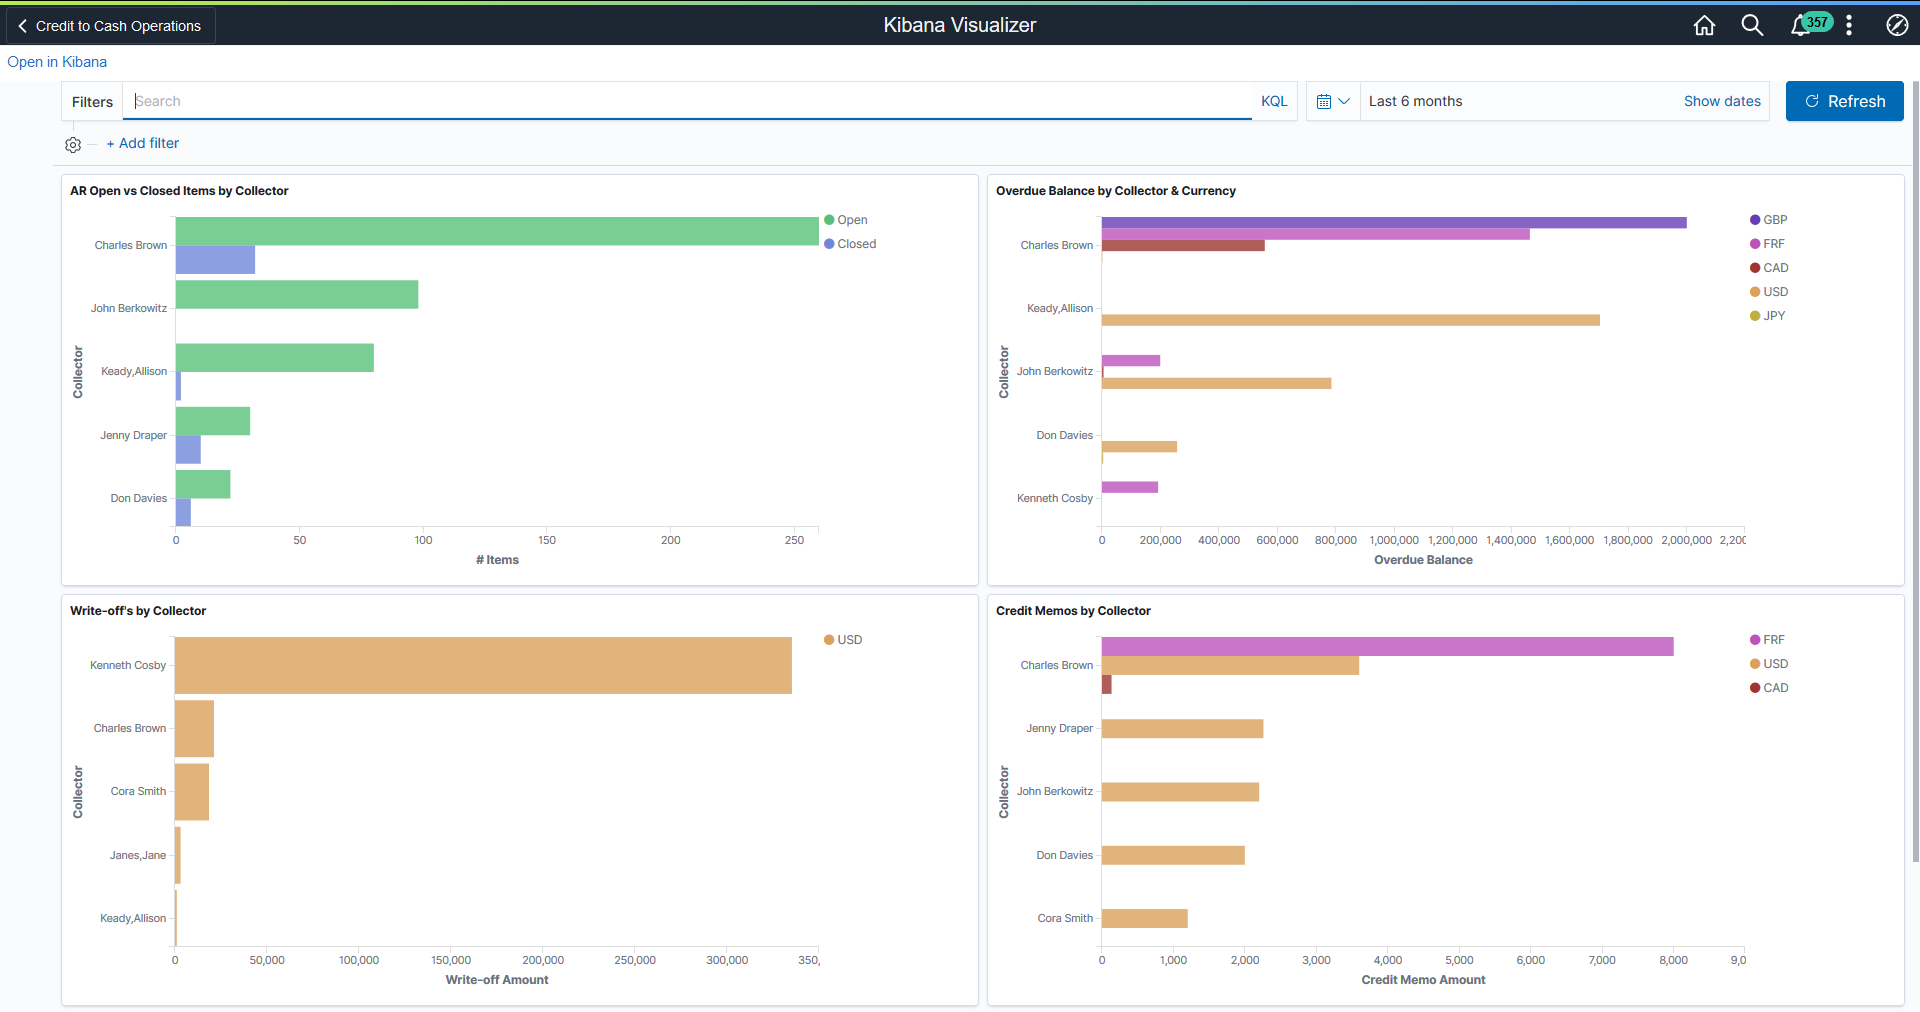
This example illustrates the fields and controls on the Collector Performance dashboard.
There are no delivered filters for the Collector Performance dashboard. However, you can use the Add Filter link to add filters to the dashboard.
The following visualizations are part of this dashboard:
AR Open vs Closed Items by Collector: Provides an analysis of total open items versus closed items by individual collector.
Overdue Balance by Collector and Currency: Provides an analysis of total overdue balance by individual collector.
Write-Offs by Collector: Provides an analysis of total write-off amount from uncollectible accounts by individual collector.
Credit Memos by Collector: Provides an analysis of total credit memos issued by individual collector.
Item Detail: Displays a list of items making up the data shown in the visualizations. Use the Item Detail link to access the Item Activity Page and view further details about the item or modify information as needed.
Each visualization can be viewed separately in full screen. You can also drill down for more information using the Inspect option. That data can be downloaded as a CSV file.
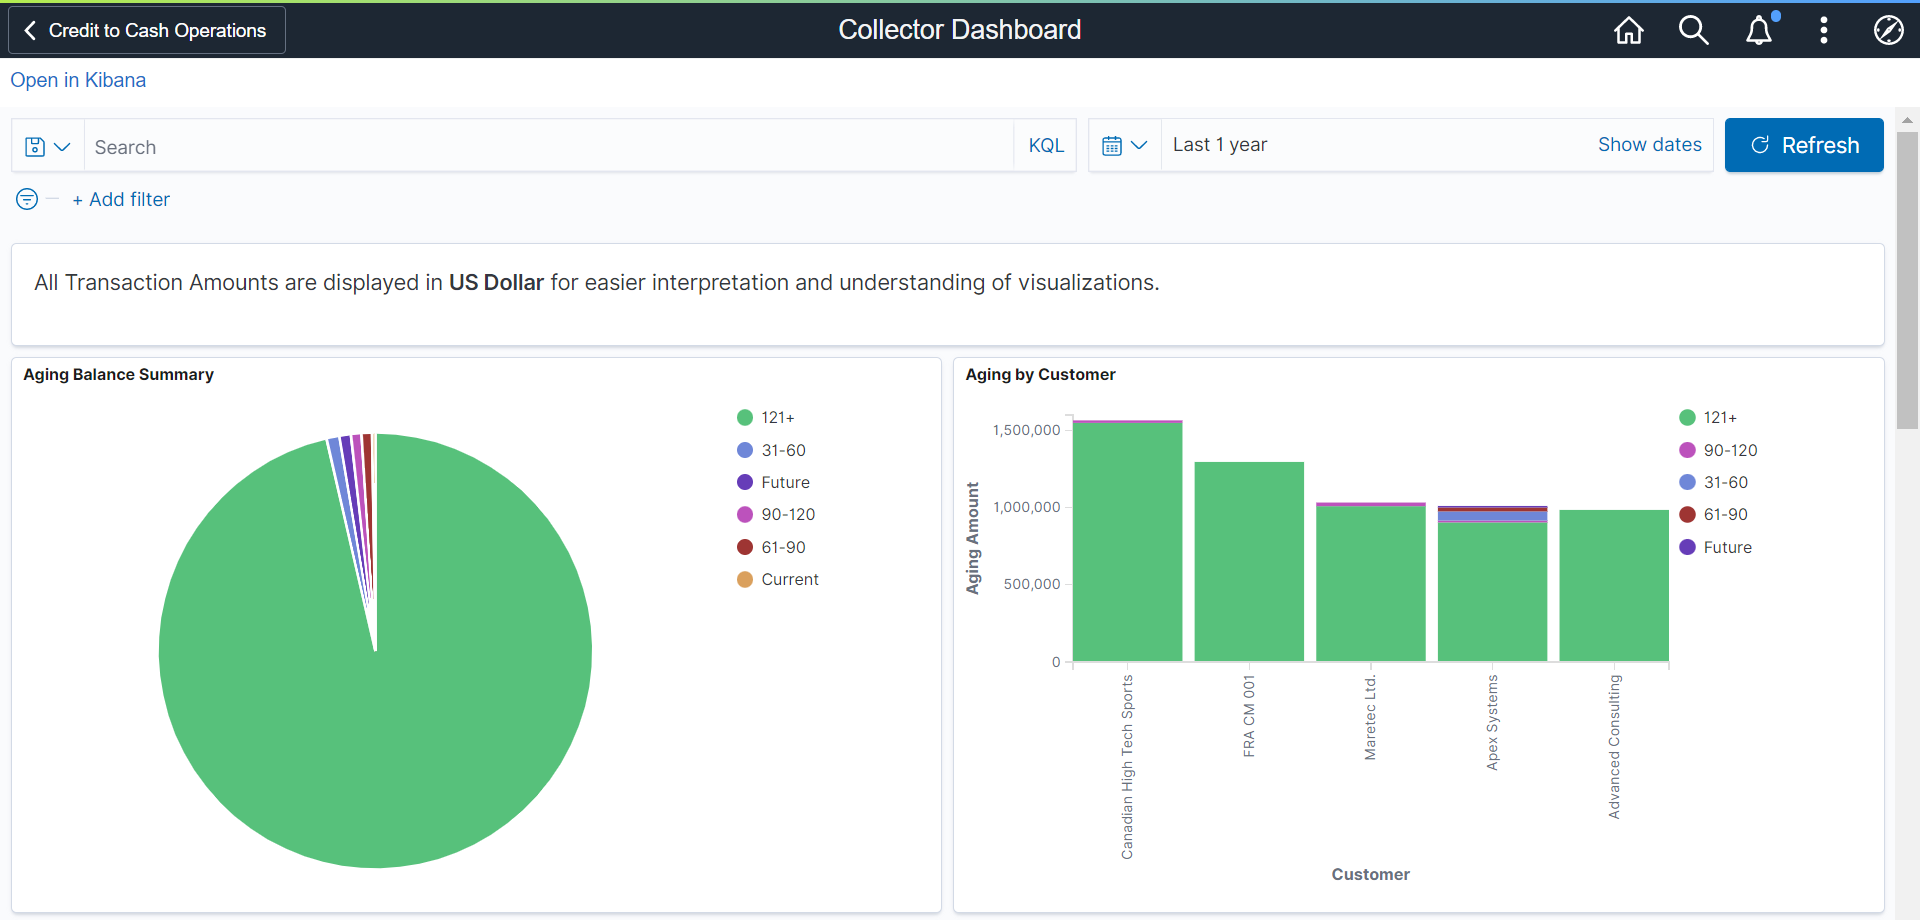
Use the Collector Dashboard to view aging and history activity by customer.
This dashboard is for individual collectors to monitor the customers assigned to them.
It also allows the users to view information such as Aging Balance Summary, Aging by Customer, Highest Balance Receivables by Customer, and Average Days Late by Customer.
Navigation:
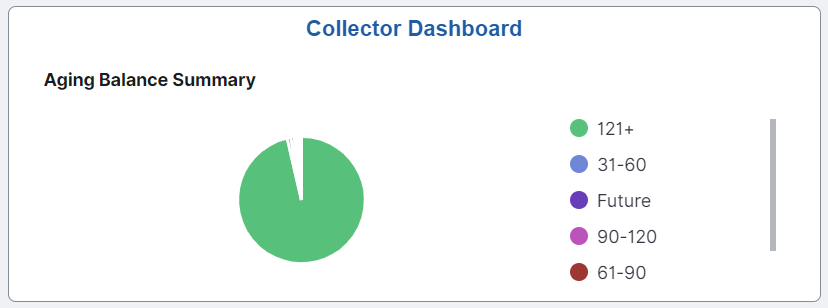
This example illustrates the fields and controls on the Collector Dashboard (1 of 2).
This example illustrates the fields and controls on the Collector Dashboard (2 of 2).
The following visualizations are part of this dashboard:
Aging Balance Summary: Provides a summary of the aging balances by aging category.
Aging by Customer: Provides an analysis of balances that are due from customers.
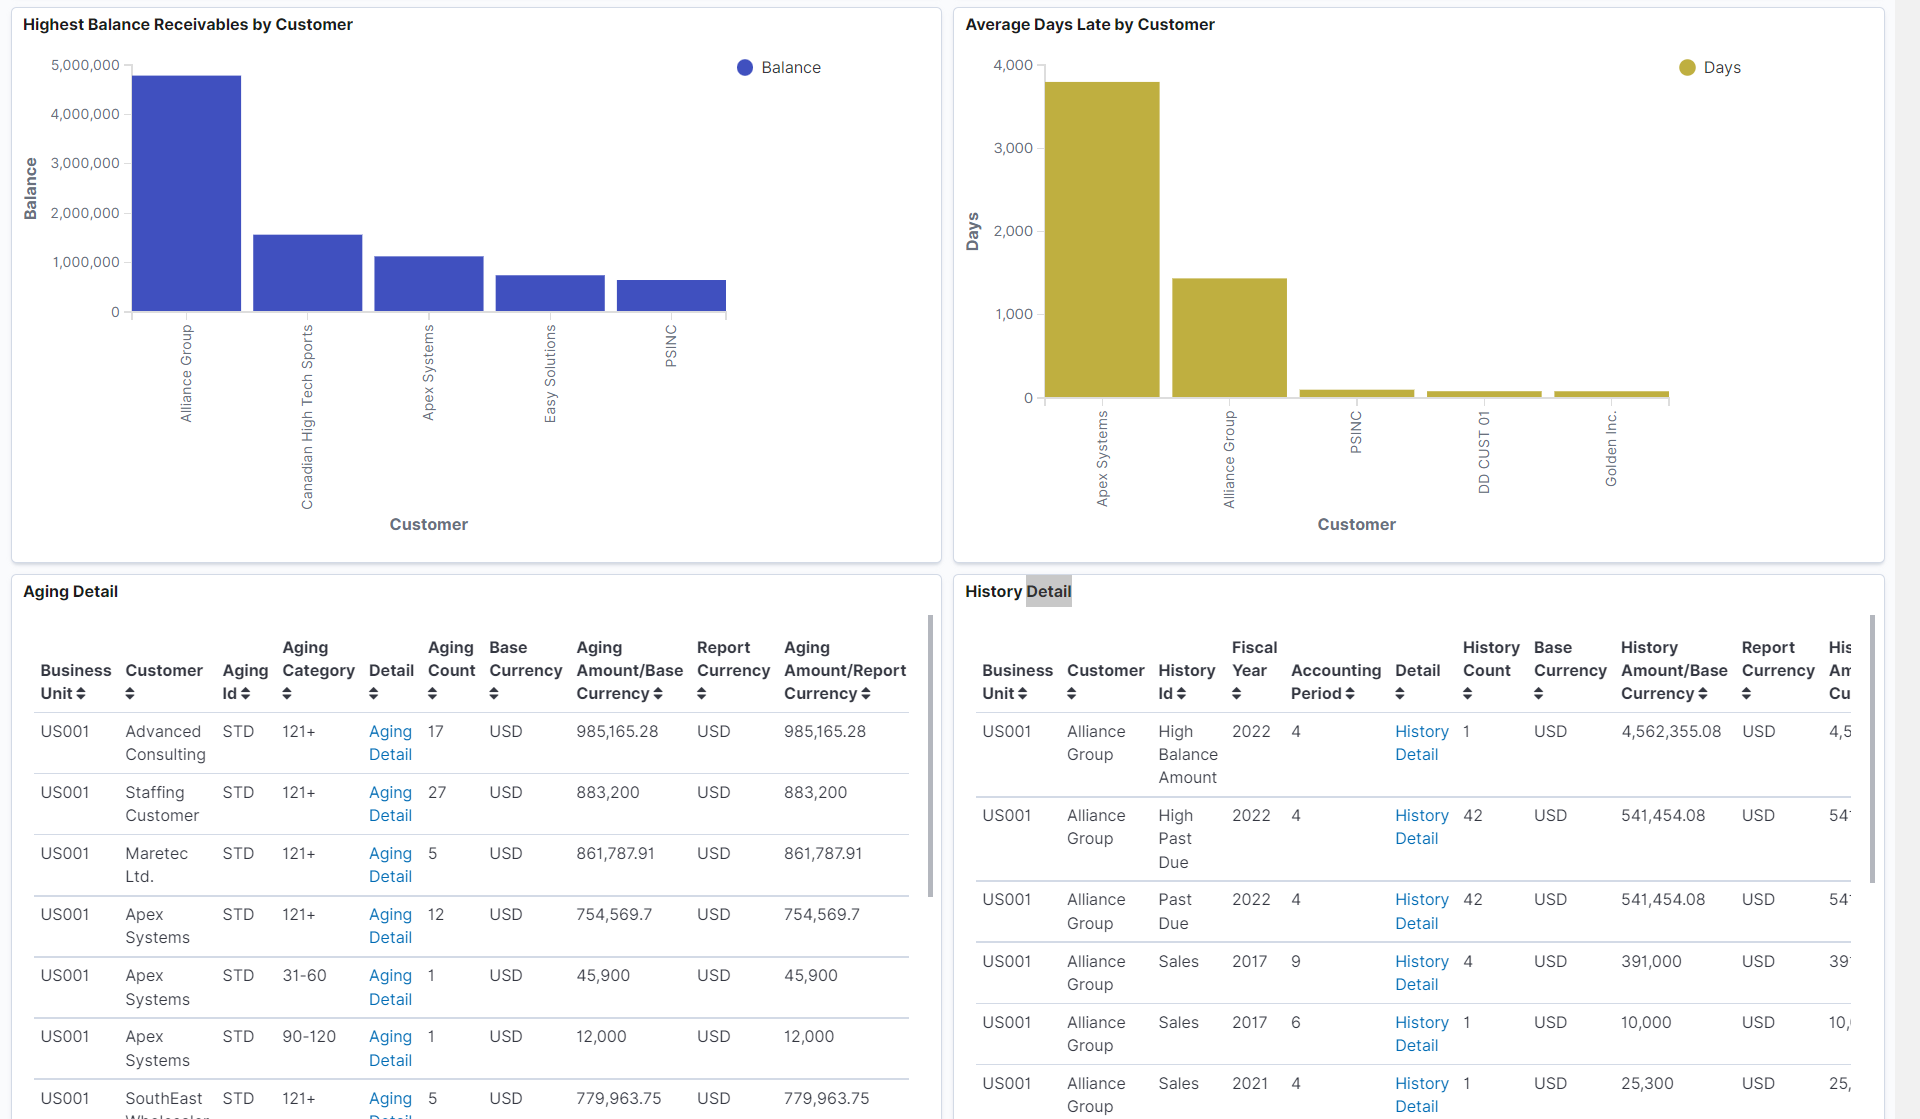
Highest Balance Receivables by Customer: Provides an analysis of highest receivable balance by customer.
Average Days Late by Customer: Provides an analysis of average late days by the customers.
Aging Detail: Displays a list of Aging Detail shown in the visualizations. Use the Aging Detail link to access the Customer Aging page and view further details about the item or modify information as needed.
History Detail: Displays a list of History Detail shown in the visualizations. Use the History Detail link to access the Customer History page and view further details about the item or modify information as needed.
Note: The Collector Dashboard and Collections Manager Dashboard use two search definitions. When adding filters to the dashboards, you can select either search definition. If the data is present in one search definition and not the other, the visualization will not display any data.
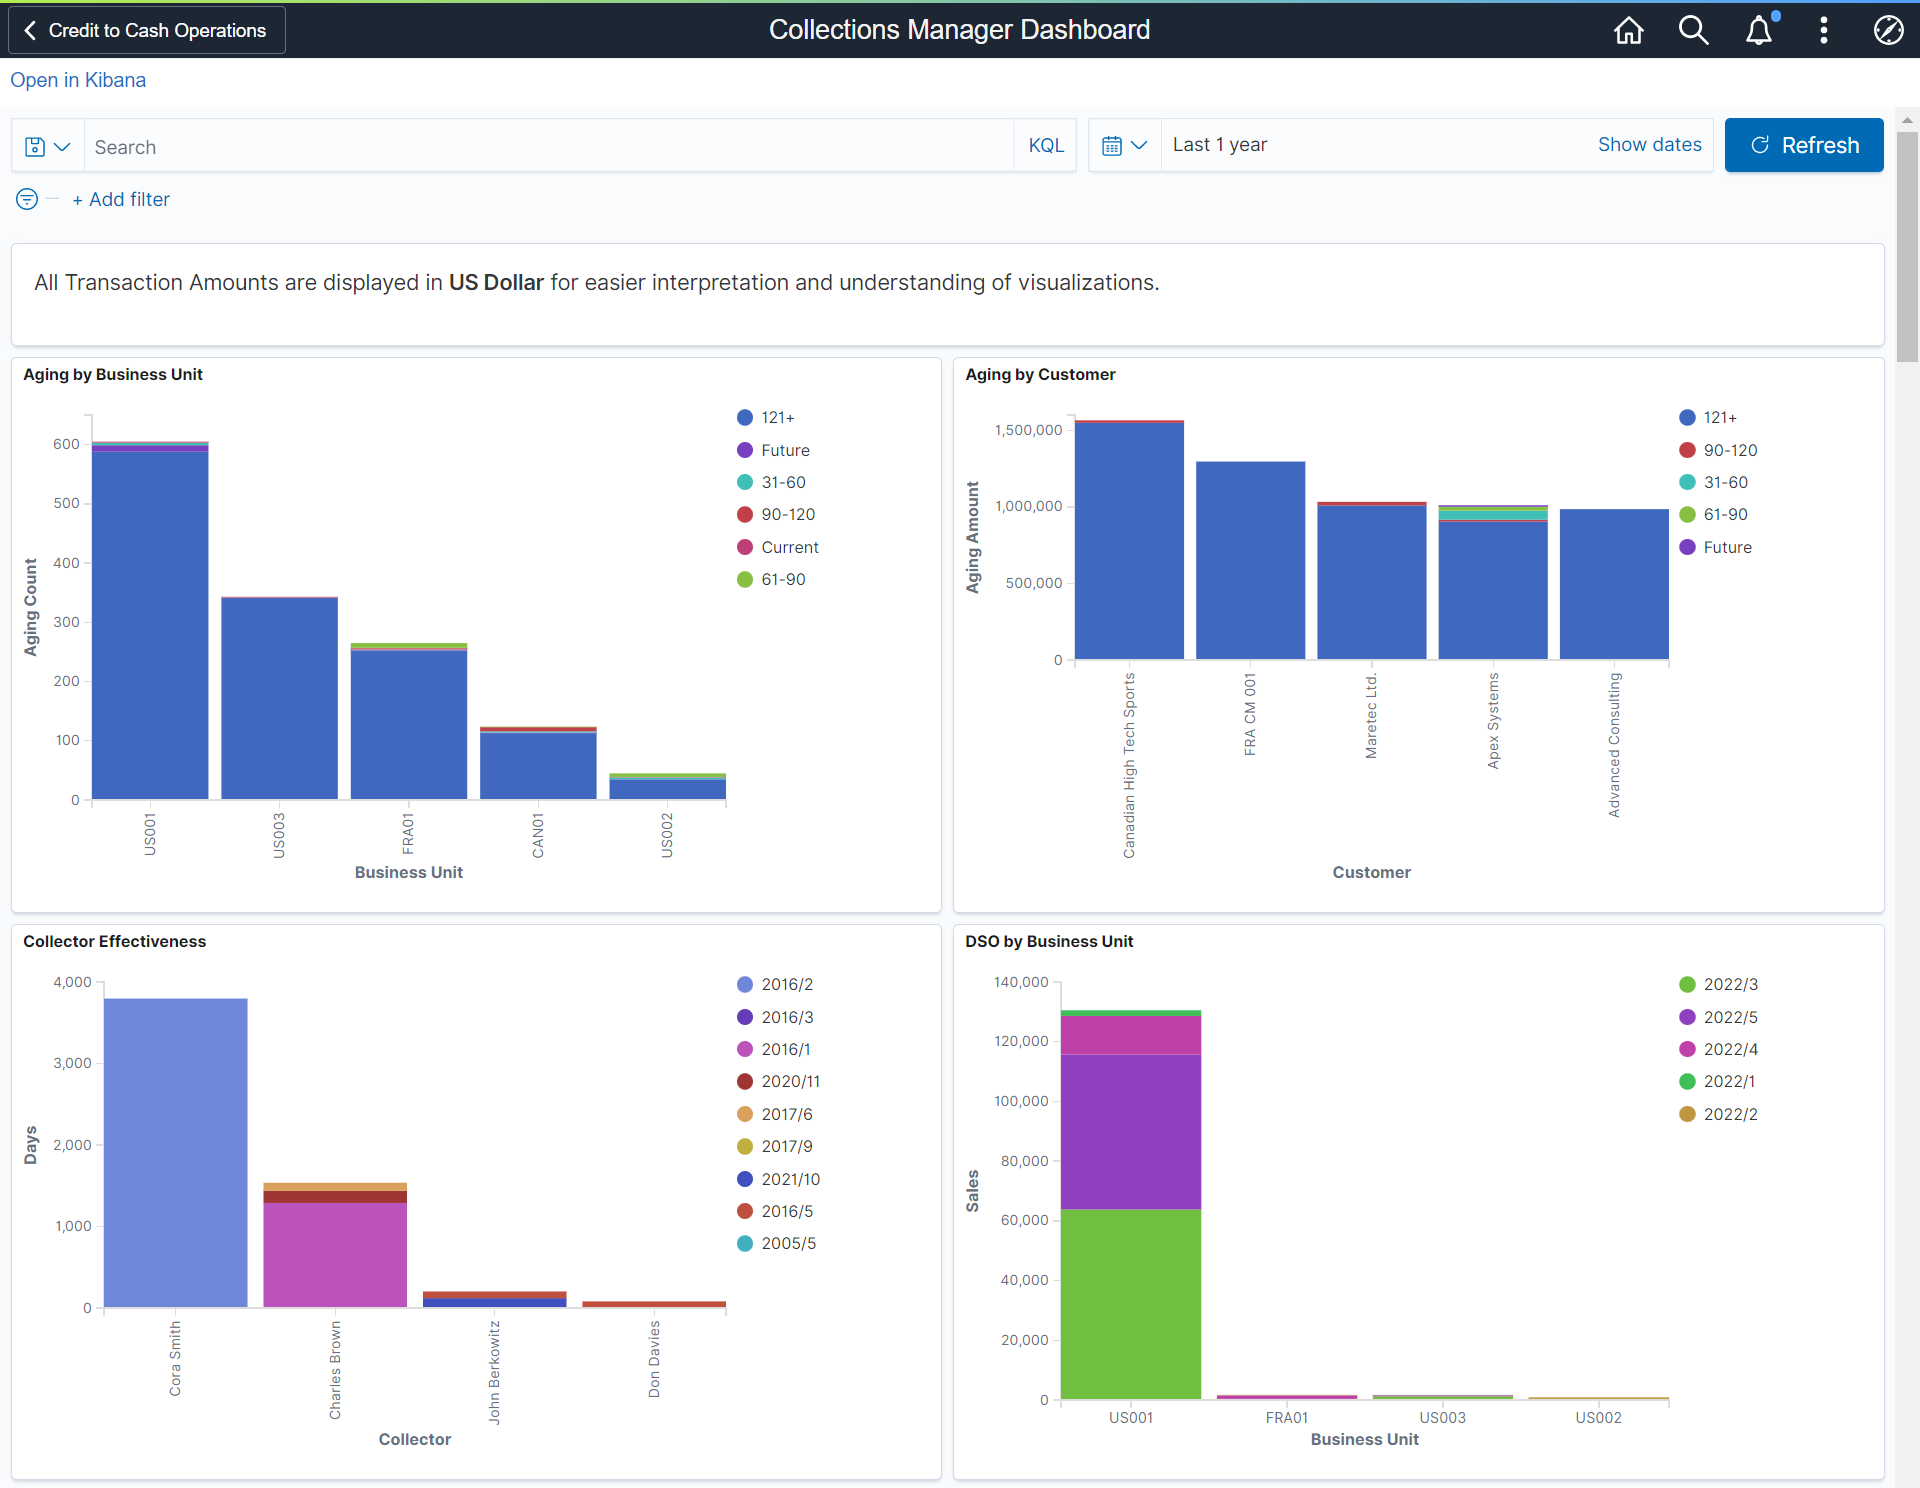
Use the Collections Manager Dashboard to view aging and history activity across Receivables.
This dashboard is for collections managers to monitor the collectors across Receivables.
It allows users to view information such as Aging by Business Unit, Aging by Customer, Collector Effectiveness (average days late), DSO by Business Unit, Highest Balance Receivables by Customer and Highest Balance Receivables by Collector.
Navigation:
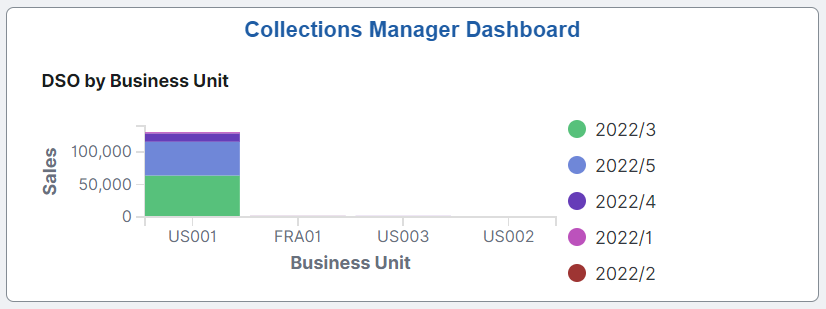
This example illustrates the fields and controls on the Collections Manager Dashboard (1 of 2).
This example illustrates the fields and controls on the Collections Manager Dashboard (2 of 2).
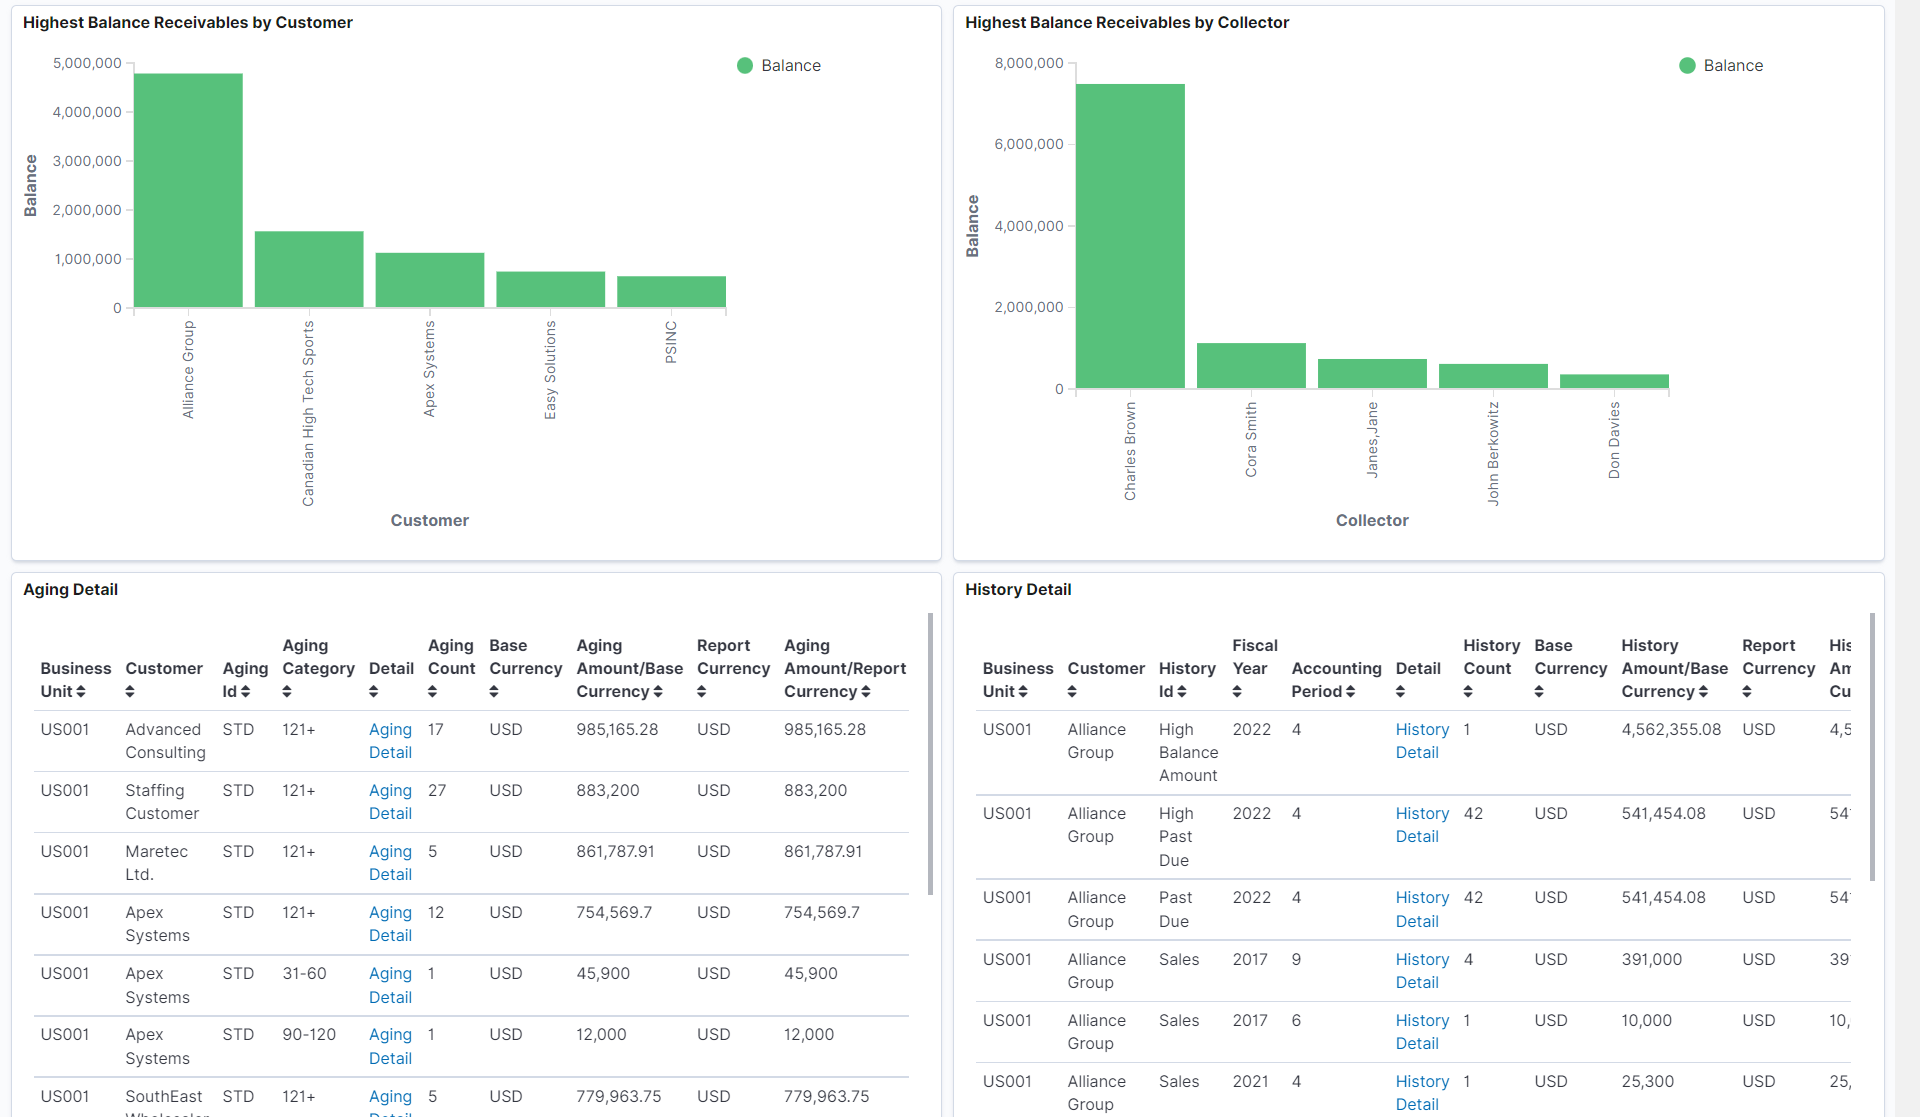
The following visualizations are part of this dashboard:
Aging by Business Unit: Provides a summary of the aging by business unit.
Aging by Customer: Provides an analysis of aging balances that are due from customers.
Collector Effectiveness: Provides an analysis of Collector's Effectiveness by showing the average days late by fiscal year and period.
DSO by Business Unit: Provides an analysis of days sales outstanding for the business units.
Highest Balance Receivables by Customer: Provides an analysis of highest receivable balance by customer.
Highest Balance Receivables by Collector: Provides an analysis of highest receivable balance by collector.
Aging Detail: Displays a list of Aging Detail shown in the visualizations. Use the Aging Detail link to access the Customer Aging page and view further details about the item or modify information as needed.
History Detail: Displays a list of History Detail shown in the visualizations. Use the History Detail link to access the Customer History page and view further details about the item or modify information as needed.