Working with Customer Analysis Pagelets
This topic describes the customer analysis pagelets in the PeopleSoft Classic Comprehensive Customer View.
|
Pagelet Name |
Query Name |
Usage |
Product |
|---|---|---|---|
|
C360_AR_DB_CUST_AGING |
View the aging balance by aging category and a count of open items making up the aging balance. The Aging ID in the query defaults from the AR Business Unit options. |
Receivables |
|
|
C360_AR_ITEM_PVG |
View the customer’s items balance by month and year. |
Receivables |
|
|
C360_BI_BILL_STATUS |
View the customer’s invoice amount by status. |
Billing |
|
|
C360_CONTRACT_STATUS_PVG |
View contract status and type by net amount. |
Contracts |
|
|
C360_DISPUTE_AMT_PVG |
View the customer’s amount in dispute by month and year. |
Receivables |
|
|
C360_PV_RINV_QRY |
View the invoice amount by month and year. |
Billing |
|
|
C360_OVERDUE_AMT_ANALYSIS |
View a customer’s overdue amount by month and year. |
Receivables |
|
|
C360_WRITE_OFF_ANALYSIS |
View customer write-off amounts by year. |
Receivables |
The customer analysis pagelets use pivot grids to display and filter analysis data.
Pivots grids are based on PS Queries and can display the results in a grid format, a chart format, or both. You use the Pivot Grid Wizard (). For more information about fields and controls in pivot grids, see the product documentation for PeopleTools: Pivot Grid.
You can choose the type of graph – including bar, line, and pie charts – to display. The system uses the following prompts to display data in the graph:
SetID
Display Currency (all balances converted to this currency)
Business Unit
Customer (multiple values, according to Customer Level – Corporate, Remit From, or Correspondence)
Use the collapsible Pivot Grid section to customize the returned data in the graph after the system filters are applied. You can also access and edit the filter values by clicking the action glyph next to the pagelet title. This is a temporary filter and values are not saved for later use. To save filters, edit the Analysis Filters on the My Personalization page. See Understanding Pagelets in the PeopleSoft Classic Comprehensive Customer View.
Term |
Definition |
|---|---|
Detailed View |
Click the pie sections or bars in the graph, or the display amount value links in the Pivot Grid section table, to view details on the Pivot Grid Drilldown page. |
Use the Customer Aging Analysis pagelet (C360_AR_DB_CUST_AGING) to view the aging balance by aging category and a count of open items making up the aging balance. The Aging ID in the query defaults from the AR Business Unit options.
This example illustrates the fields and controls on the Customer Aging Analysis pagelet.
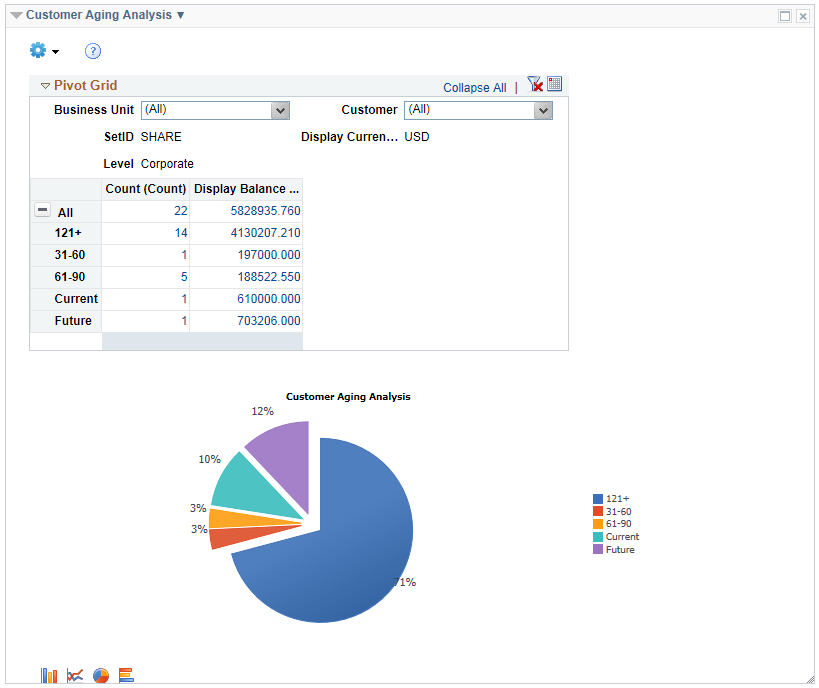
You can also use the Customer Aging Analysis Filter to further refine the returned data. To save filters, edit the filters on the My Personalization page.
Use the Customer Items Balance Analysis pagelet (C360_AR_ITEM_PVG) to view the customer’s items balance by month and year.
This example illustrates the fields and controls on the Customer Items Balance Analysis pagelet.
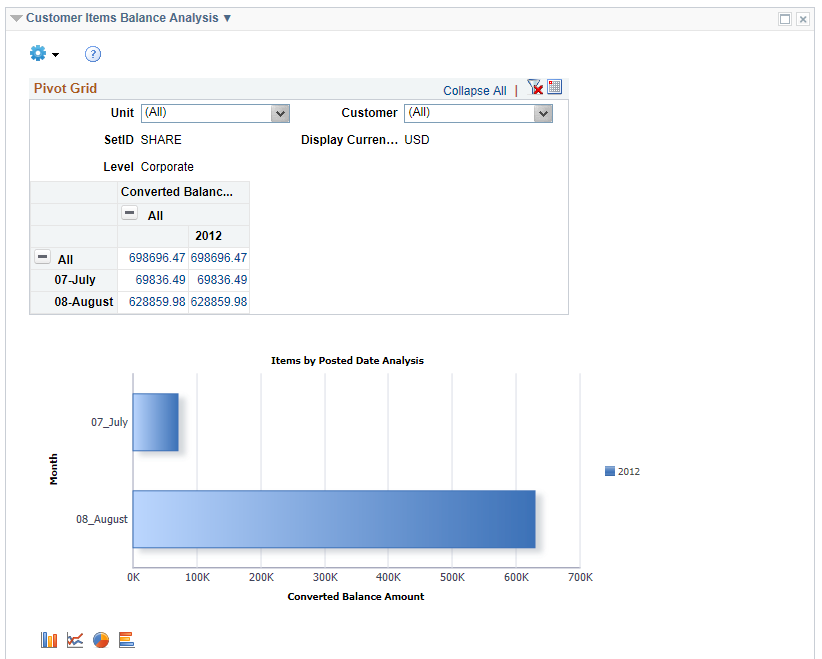
You can also use the Customer Items Analysis Filter to further refine the returned data. To save filters, edit the filters on the My Personalization page.
Use the Customer Bill By Status Analysis pagelet (C360_BI_BILL_STATUS) to view the customer’s invoice amount by status.
This example illustrates the fields and controls on the Customer Bill By Status Analysis pagelet.
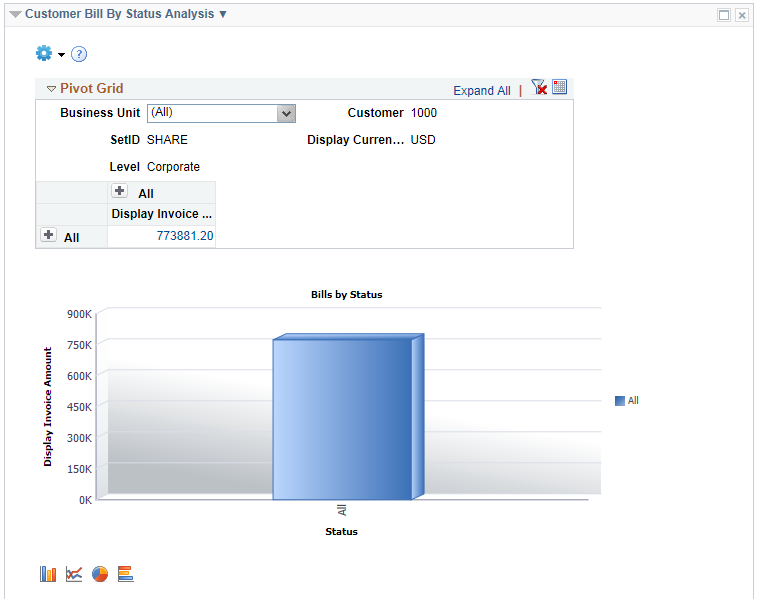
You can also use the Customer Bill By Status Analysis Filter to further refine the returned data. To save filters, edit the filters on the My Personalization page.
Use the Customer Contract Status Analysis pagelet (C360_CONTRACT_STATUS_PVG) to view contract status and type by net amount.
This example illustrates the fields and controls on the Customer Contract Status Analysis pagelet.
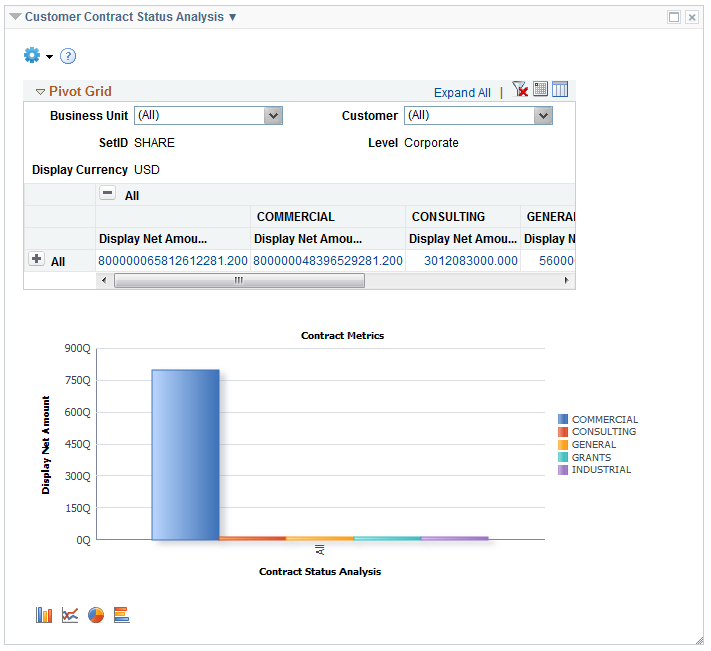
You can also use the Customer Contracts Analysis Filter to further refine the returned data. To save filters, edit the filters on the My Personalization page.
Use the Customer Dispute Amount Analysis pagelet (C360_DISPUTE_AMT_PVG) to view the customer’s amount in dispute by month and year.
This example illustrates the fields and controls on the Customer Dispute Amount Analysis pagelet. You can find definitions for the fields and controls later on this page.
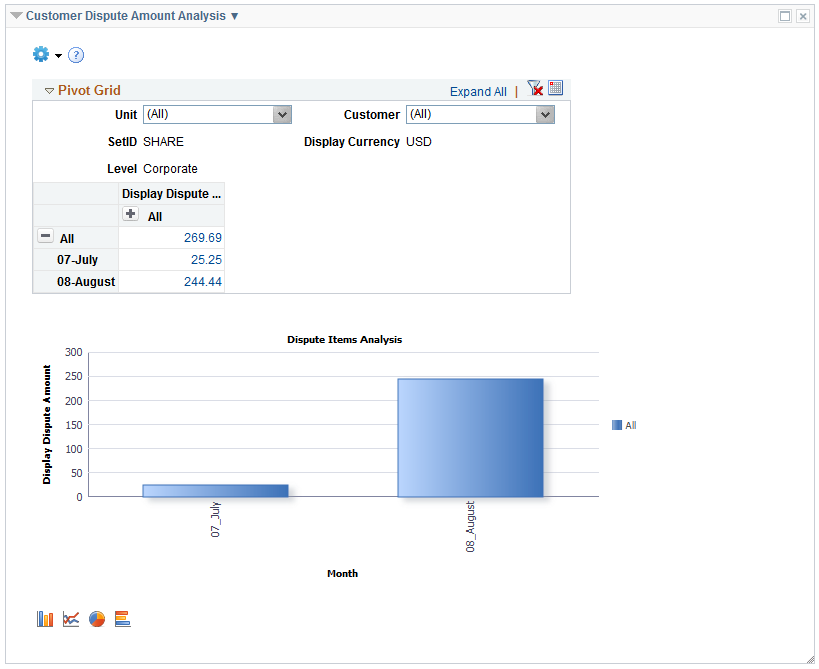
You can also use the Customer Dispute Items Analysis Filter to further refine the returned data. To save filters, edit the filters on the My Personalization page.
Use the Customer Invoice Analysis by Month pagelet (C360_PV_RINV_QRY) to view the invoice amount by month and year.
This example illustrates the fields and controls on the Customer Invoice Analysis by Month pagelet.
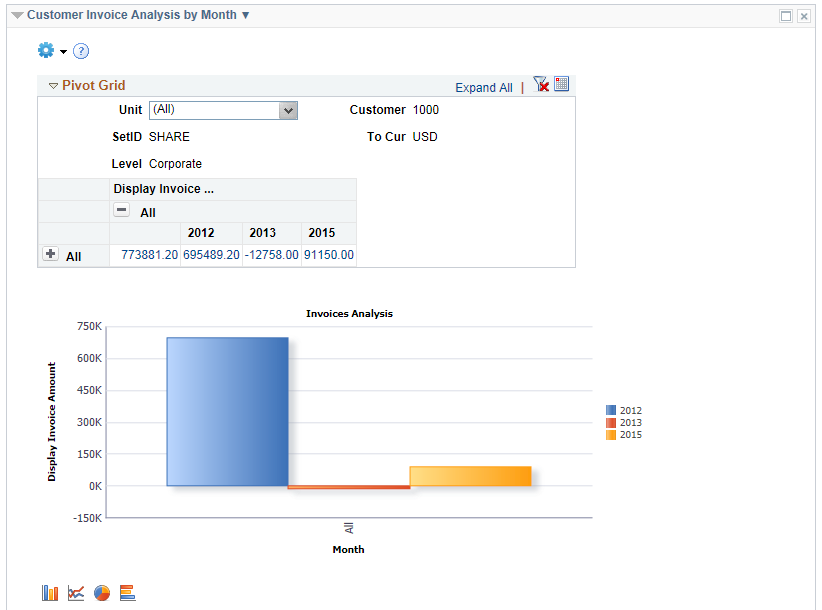
You can also use the Customer Invoices Analysis Filter to further refine the returned data. To save filters, edit the filters on the My Personalization page.
Use the Customer Overdue Amount Analysis pagelet (C360_OVERDUE_AMT_ANALYSIS) to view a customer’s overdue amount by month and year.
This example illustrates the fields and controls on the Customer Overdue Amount Analysis pagelet.
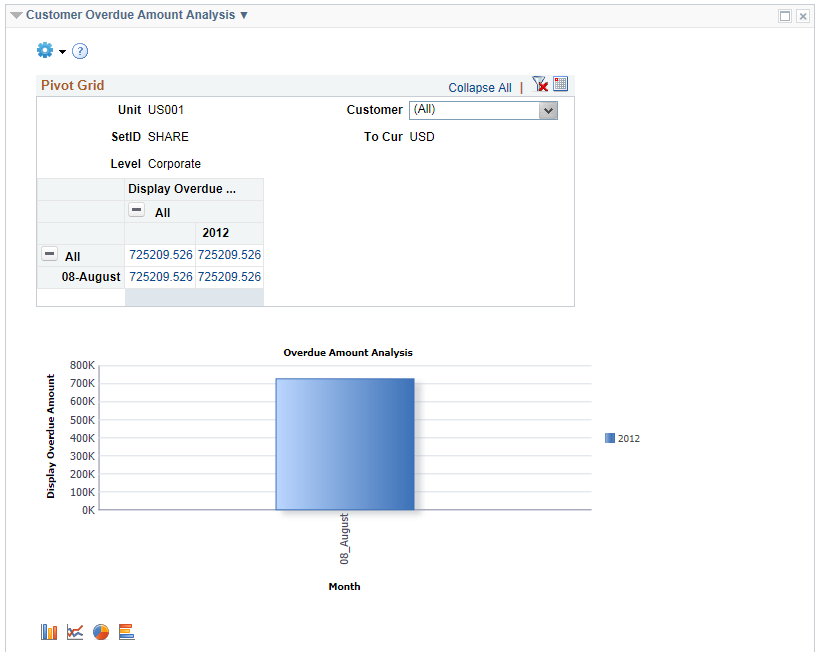
You can also use the Customer Overdue Amounts Analysis Filter to further refine the returned data. To save filters, edit the filters on the My Personalization page.
Use the Customer Write-Off Analysis pagelet (C360_WRITE_OFF_ANALYSIS) to view customer write-off amounts by year.
This example illustrates the fields and controls on the Customer Write-Off Analysis pagelet.
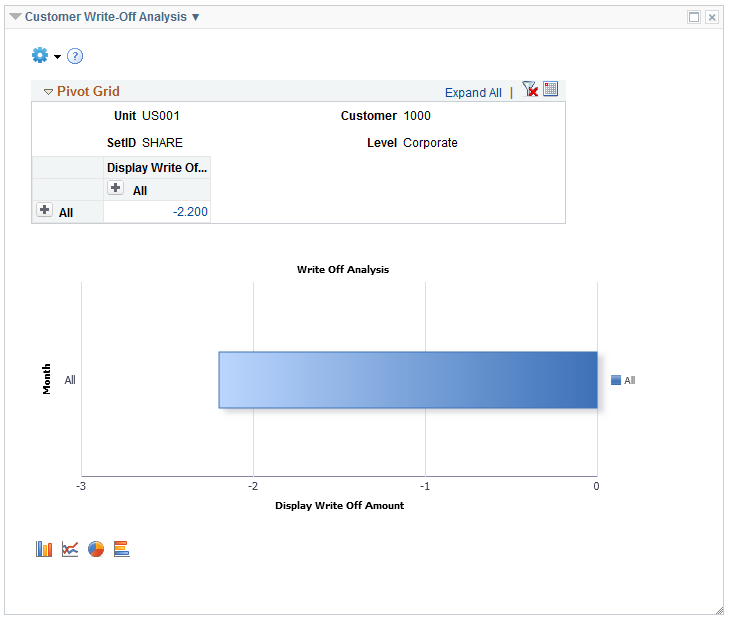
You can also use the Customer Write Off Amounts Analysis Filter to further refine the returned data. To save filters, edit the filters on the My Personalization page.
Field or Control |
Description |
|---|---|
Detailed View |
Click the bars in the graph or the display amount value links in the Pivot Grid section to view details on the Pivot Grid Drilldown page. |