Understanding PeopleSoft Quality Methods
Quality provides industry-accepted methods for applying statistical process control (SPC) practices to manufacturing operations. These methods help you:
Monitor several processes simultaneously, in real-time, to assess stability and identify out-of-control conditions.
Generate alarms and dispatch them online by using electronic mail or Workflow.
Characterize, stabilize, and improve the process by using advanced statistics and graphing techniques.
Note: The product is delivered with many industry-standard definitions for control charts, control tests, and control procedures. You can elect to use these defaults or create specific methods. If you use the system's standard definitions, you don't have to use this topic to get started.
All the configured methods are available for use by Quality during both online and offline data analysis (Quality application client).
Control charts are graphical representations of data that is associated with a process, plotted over time.
Use these charts to:
Monitor a process to determine stability.
Visualize trends and variability.
Note and track process adjustments.
Investigate causes of unacceptable or marginal quality.
PeopleSoft provides you with seven industry-standard control charts. These charts are time-series charts for monitoring and controlling processes or equipment. Each control chart has a unique chart ID that represents a different display format.
Using the Control Chart component, you can define custom charts to reflect special control requirements or labeling conventions. The charts are based on industry-standard control charts and are applicable to a specific data type.
Note: Chart IDs 1 through 7 are supplied as industry-standard system defaults.
|
Chart ID |
Description |
Data Type |
|---|---|---|
|
1 |
X and Moving Range. |
Variables |
|
2 |
Xbar and Range. |
Variables |
|
3 |
Xbar and Sigma. |
Variables |
|
4 |
c Chart. |
Defects |
|
5 |
u Chart. |
Defects |
|
6 |
p Chart. |
Defectives |
|
7 |
np Chart. |
Defectives |
These tables illustrate the structure of each control chart.
Note: Some control charts are comprised of two individual subcharts for plotting means and variances together. These subcharts are labeled as chart 1 or chart 2 in the tables.
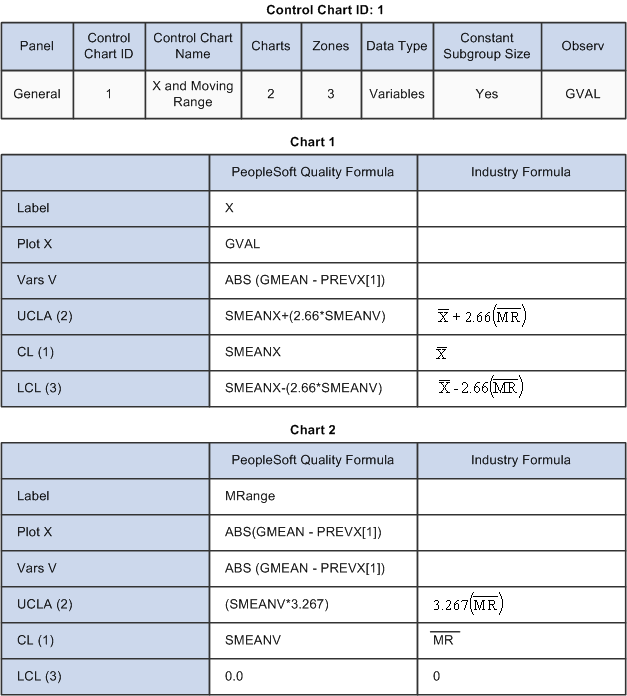
Control Chart ID: 1
This graphic shows Control Chart ID 1
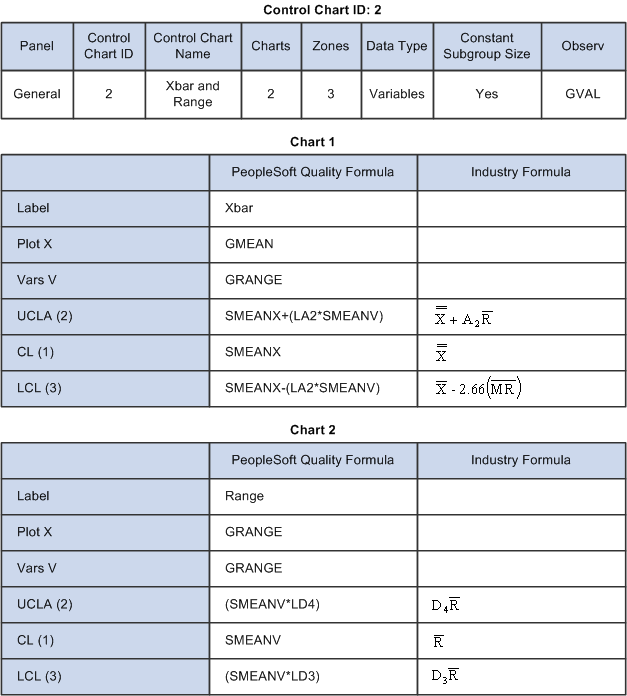
Control Chart ID: 2
This graphic displays Control Chart ID 2
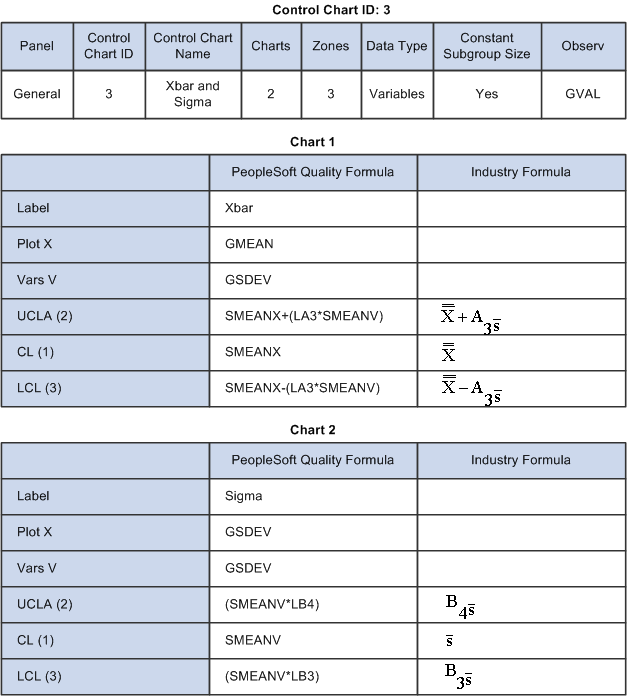
Control Chart ID: 3
This graphic displays Control Chart ID 3
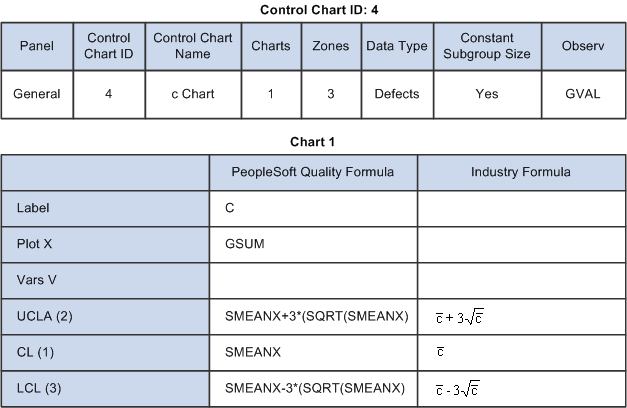
Control Chart ID: 4
This graphic displays Control Chart ID 4
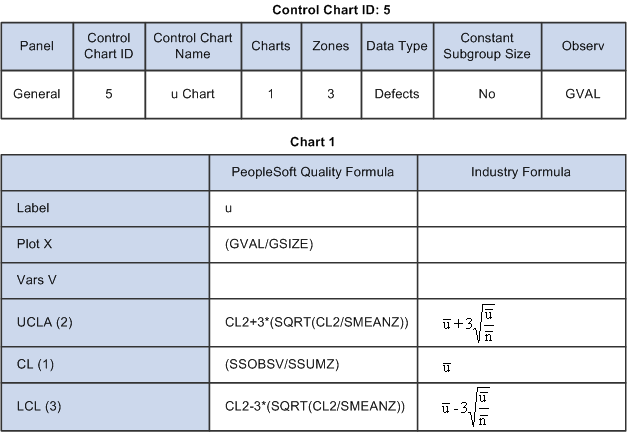
Control Chart ID: 5
This graphic displays Control Chart ID 5
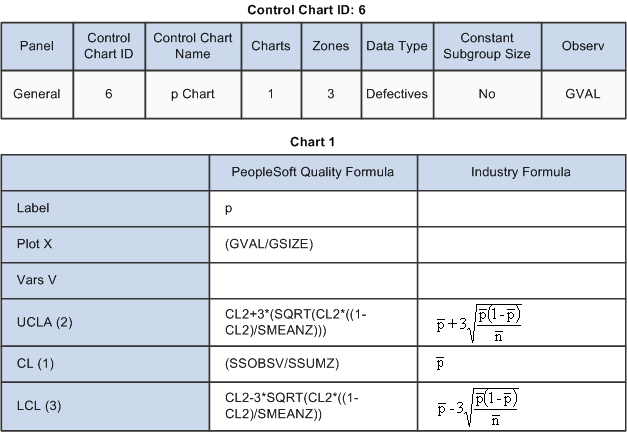
Control Chart ID: 6
This graphic displays Control Chart ID 6
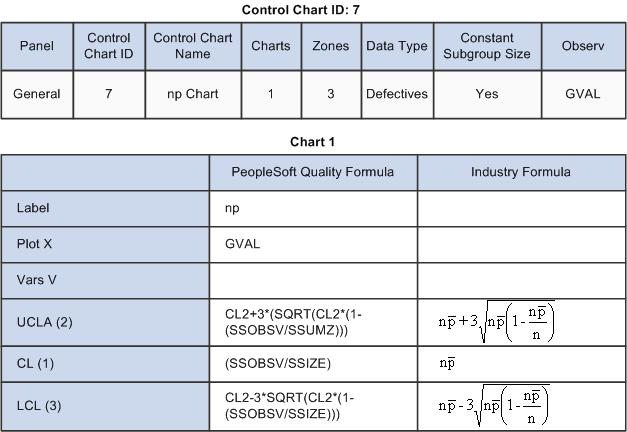
Control Chart ID: 7
This graphic displays Control Chart ID 7
To assess ongoing control and stability, you test incoming sample data online against various statistical conditions. Each condition is represented by a control test that is applied to subgroups that are plotted on a control chart. Quality includes a set of 17 default control tests. Each test is based on a standard Shewhart pattern for identifying special causes of variability. Use the default test or create control tests from the industry-standard default prototypes.
You can selectively apply the tests to mean or variance charts, and control the sensitivity of each test by specifying the number of points to evaluate and the number of points in the pattern that are required for triggering a violation. If a data point (subgroup) violates one or more control tests, the system generates an alarm. The system identifies a test by a unique ID number and description.
Note: Control tests 1 through 17 are supplied as industry-standard system defaults. You can't change the prototype fields for these tests.
|
Test ID Number |
Description |
Prototype |
Chart |
k of K |
|---|---|---|---|---|
|
1 |
Specification limit violation. |
1 |
1 |
1 of 1. |
|
2 |
Control limit violation (mean). |
2 |
1 |
1 of 1. |
|
3 |
Control limit violation (variance). |
2 |
2 |
1 of 1. |
|
4 |
Trend - 7 pts (mean). |
4 |
1 |
7 of 7. |
|
5 |
Shift - 2 of 3 pts (mean). |
6 |
1 |
2 of 3. |
|
6 |
Shift - 4 of 5 pts (mean). |
7 |
1 |
4 of 5. |
|
7 |
Shift - 8 of 8 pts (mean). |
3 |
1 |
8 of 8. |
|
8 |
Mixture - 8 pts (mean). |
9 |
1 |
8 of 8. |
|
9 |
Systematic variable - 14 pts (mean). |
5 |
1 |
14 of 14. |
|
10 |
Stratification - 15 pts (mean). |
8 |
1 |
15 of 15. |
|
11 |
Trend - 7 pts (variance). |
4 |
2 |
7 of 7. |
|
12 |
Shift - 2 of 3 pts (variance). |
6 |
2 |
2 of 3. |
|
13 |
Shift - 4 of 5 pts (variance). |
7 |
2 |
4 of 5. |
|
14 |
Shift - 8 of 8 pts (variance). |
3 |
2 |
8 of 8. |
|
15 |
Mixture - 8 pts (variance). |
9 |
2 |
8 of 8. |
|
16 |
Systematic variable - 14 pts (variance). |
5 |
2 |
14 of 14. |
|
17 |
Stratification - 15 pts (variance). |
8 |
2 |
15 of 15. |
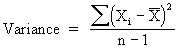
The standard Control Test Prototypes are defaults that are shipped with Quality. The prototypes illustrate the basic pattern that is evaluated. Control tests that you create are variations that are based on specific prototypes.
|
Illustration |
Description |
|---|---|
|
Value < LSL or > USL. |

|
Current point beyond zone A. |
|
K consecutive points in zone C or beyond. |

|
K consecutive points steadily increasing or decreasing. |
|
K consecutive points alternating up and down. |
|
k of K consecutive points in zone A or beyond. |
|
k of K consecutive points in zone B or beyond. |
|
K consecutive points in zone C above and below the centerline. |
|
K consecutive points beyond zone C. |
Control procedures are a convenience mechanism that you use to specify an overall testing and control scheme that is executed as process data is collected and analyzed. Each procedure is comprised of a list of control tests (listed in order of execution), and optionally, subgroup milestones indicating a progression for control limit calculations. You associate procedures with inspection characteristics to achieve the desired level of process control, feedback, and alarming.
PeopleSoft provides four predefined control procedures, each with a varying number of tests. You can use these predefined control procedures, modify them, or create a set of procedures:
|
Control Procedure ID # |
Description |
Control Tests |
|---|---|---|
|
1 |
Level I |
Specification limit violation. |
|
1 |
Level I |
Control limit violation (variance). |
|
1 |
Level I |
Control limit violation (mean). |
|
2 |
Level II |
Level I +. |
|
2 |
Level II |
Trend - 7 pts (mean). |
|
2 |
Level II |
Shift - 2 of 3 pts (mean). |
|
2 |
Level II |
Shift - 4 of 5 pts (mean). |
|
2 |
Level II |
Shift - 8 of 8 pts (mean). |
|
3 |
Level III |
Level II +. |
|
3 |
Level III |
Trend - 7 pts (variance). |
|
3 |
Level III |
Shift - 2 of 3 pts (variance). |
|
3 |
Level III |
Shift - 4 of 5 pts (variance). |
|
3 |
Level III |
Shift - 8 of 8 pts (variance). |
|
4 |
Level IV |
Level III +. |
|
4 |
Level IV |
Mixture - 8 pts (mean). |
|
4 |
Level IV |
Systematic variable - 14 pts (mean). |
|
4 |
Level IV |
Stratification - 15 pts (mean). |
|
4 |
Level IV |
Mixture - 8 pts (variance). |
|
4 |
Level IV |
Systematic variable - 14 pts (variance). |
|
4 |
Level IV |
Stratification - 15 pts (variance). |
Sampling codes indicate inspection priorities among characteristics and specify the needed frequency of inspection sampling. The codes can also help meet customer or regulatory auditing, reporting, and certification requirements by enhancing inspection instructions and associated documentation. The system provides code libraries for characteristic and inspection frequency classifications.