Creating a Visualization for Application Data
Search Framework enables you to create visualizations based on application data, which is indexed in OpenSearch. You create a visualization and dashboard in OpenSearch Dashboards.
This section discusses the steps that should be completed before you can use the newly created dashboards and its visualizations:
Import a newly created dashboard.
Configure a dashboard as a tile or related information.
Specify user privileges for a dashboard.
After completing these steps, the dashboard is ready for use by an end user. For instructions on using a dashboard, see Using a Dashboard.
Creating a visualization from scratch involves creating an index pattern. In the PeopleSoft implementation of OpenSearch Dashboards, an index pattern is associated with a search definition, so a visualization is based on a search definition. The index pattern identifies the mapping of the indexed fields. You could also use an index pattern that has already been created if you need to create a visualization based on the same search definition.
A user with the Search Administrator role or a user with create privilege specified on the Insights Privileges page can create a visualization.
See Specifying User Privileges.
Before you can create a visualization, you need to create an index pattern.
To create a new visualization, complete the following steps:
On the Insights home page, select the Management icon.
The Management page displays existing index patterns, if any.
Note: You must specify one of the index patterns as the default index pattern. If you do not set a default search pattern, users may see error messages when they attempt to view any of the dashboards.
Select Create index pattern.
The Create index pattern page displays the application data indexes that are indexed in OpenSearch. The indexes are suffixed with a database name.
For Step 1: Define index pattern, enter an indexed search definition and suffix it with a wild card character (*) to generalize the index pattern and to avoid dependency on the database. If the search definition name that you entered matches the indexed search definition, a success message is displayed.
For example, ep_ap_payments*
When you enter a name, take into consideration the characters that can be used.
If you prefer to create a new index pattern, based on a delivered index pattern, you can name it with an additional underscore (-) before the wildcard (*), for example, ep_ap_payments_*. Thus, you can avoid overwriting your customized index pattern when PeopleSoft delivers an update on the index pattern.
Select Next Step.
For Step 2: Configure settings, enter a time filter field name or you can select I don't want to use the Time Filter.
If you select a time filter field name, OpenSearch Dashboards will use the field to filter the data by time.
Use the Show advanced options link to specify a custom name for the index pattern instead of the system-generated name.
Select Create index pattern.
On creating an index pattern, OpenSearch Dashboards displays the mapping of all the fields in the index pattern.
In the PeopleSoft implementation of OpenSearch Dashboards, you should use the field alias for aggregation to return the original text based on the required case-sensitive text.
Note: If you are using PeopleTools 8.59.02 or earlier, you may be using technical field names instead of the field name alias, which is the default in PeopleTools 8.59.03 and later versions. For instructions on remediating the issue, see Using Field Aliases in Kibana Visualizations in PeopleTools (Doc ID 2787722.1).
If additional languages are enabled in the index, the field names display the corresponding field alias.
After creating the index pattern, select the Discover icon to view the indexed documents of the index pattern.
Select a date range to filter the documents.
Note: The Discover page uses the technical names for fields rather than the alias names displayed on the index pattern.
Next, select the Visualize icon. The page lists existing visualizations, if any.
Select the plus sign to create a new visualization.
On the New Visualization page, you can see visualization types, such as, tabular form, pie chart, bar chart, region map, and so on. For instructions on creating a region map, see Creating Custom Vector Maps (Region Maps) Visualization.
Select a visualization type.
Hover over each type to read a description of the visualization type.
On the New Pie/Choose a source page, select the index pattern that you created.
Specify metrics for the visualization.
The options differ based on the visualization type.
Specify bucket aggregations as required.
Select Save, and then enter a name for the new visualization.
Select the Dashboard icon, and then select Create a new dashboard.
You may add the visualization to an existing dashboard.
You can add one or more visualizations to a dashboard.
On the Editing New Dashboard page, select Add to choose a visualization.
From the Add Panels page, select the required visualization.
Select Save, and enter a name for the new dashboard.
Note: The dashboard name should be unique.
You may add a description for the dashboard.
The new dashboard is listed on the Dashboard page.
For details on creating visualizations and using the various features of OpenSearch Dashboards, refer to the OpenSearch Dashboards documentation [2.3.0] on www.opensearch.org.
Region maps can be created using default vector maps or custom vector maps. The default vector maps cover the majority of the use cases, but if you have any requirements that are not covered by vector maps, you can use custom vector maps. To create custom vector maps, a GeoJSON file with the required vectors needs to be imported.
For more information on custom GeoJSON, refer to the OpenSearch blog (https://opensearch.org/blog/whatsnew-custom-geo-json/).
To import a custom vector map, complete the following steps:
Create a JSON file to upload.
Note: The JSON file must have .geojson or .json as an extension.
In OpenSearch Dashboards, select Create Visualization to create a region map visualization.
In the right panel, select Import Vector Map.
Browse and select the .geojson file to import.
Enter the file name (lowercase and numbers only).
Click the Import file button.
If the file import is successful, the system displays a success message.
Click the Refresh button to refresh the page.
At this point, your custom region map is created, and you can use it by following these steps:
Navigate to the Layer Options tab, and select Custom vector map.
In the Vector map section, select the vector map that you just imported.
Note: The maximum file size that can be imported is 25 MB, and the maximum number of features that can be imported is 10,000.
Click the Update button.
Consider the following points when you create region maps:
The region map visualization uses OpenStreetMap and Natural Earth APIs and data for creating region maps.
OpenSearch default vector maps do not have some join fields, such as FIPS 5-2 alpha for US states. The default vector map of USA states can be used with the join field "name (en)" instead of state codes. It is recommended that the indexed data includes a field with state name to which the vector can be mapped.
OpenSearch region maps do not support the vector map for postal codes.
Example of GeoJSON File
The following is an example of GeoJSON file.
{
  "type": "FeatureCollection",
  "name": "usa counties",
  "features": [
    { "type": "Feature", "properties": { "iso2": "US", "iso3": "SF-CA", "name": "San Francisco County", "country": "US", "county": "SF" }, "geometry": { "type": "Polygon", "coordinates":[xxxx] } },
    { "type": "Feature", "properties": { "iso2": "US", "iso3": "SC-CA", "name": "Santa Cruz County", "country": "US", "county": "SC" }, "geometry": { "type": "Polygon", "coordinates":[xxxx] } }
  ]
}A newly created dashboard and visualization is an object in OpenSearch Dashboards. The dashboard and visualization must be imported in to the PeopleSoft database in order to apply the needed user privileges and to configure it as a tile or related information.
Note: Only a PeopleSoft user with the Search Administrator role can perform the task of importing dashboards. In fact, the Search Administrator role is required to perform all the subsequent tasks..
Note: Insights administration pages use the default search instance. If you configure more than one search instance, the search instance with the lowest number in priority is treated as the default search instance.
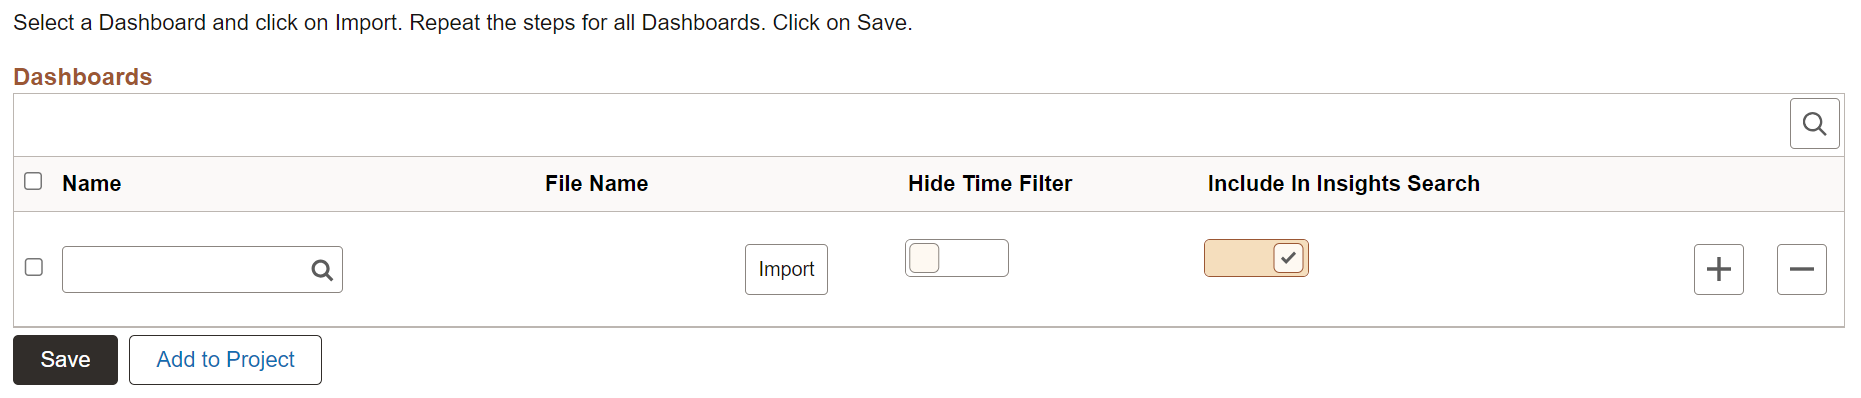
Use the Import Insights Dashboards page to import the newly created visualization and dashboard in OpenSearch Dashboards to the PeopleSoft database.
Access the Import Insights Dashboards page by selecting .
This example illustrates the fields and controls on the Import Insights Dashboards page. You can find definitions for the fields and controls later on this page.
Field or Control |
Description |
|---|---|
Name |
Choose a dashboard that you want to import. The dashboards that are created in OpenSearch Dashboards are listed here. The Import Insights Dashboards page also displays the applications-delivered dashboards that you have deployed. For information on applications-delivered dashboards, see Managing a Delivered Dashboard. |
File Name |
This field is populated when you select the Import button. This is the JSON file that OpenSearch Dashboards exports. Typically, the file name is the name of the dashboard with .json as the extension. |
|
Hide Time Filter |
Enable the Hide Time Filter button to hide the time picker from that dashboard. By default, it is disabled. |
|
Include In Insights Search |
Enable the Include In Insights Search button to include the imported dashboard for indexing in the PeopleSoft database. If included, the dashboard becomes searchable in global search using Insights search group. Note: By default, dashboards with more than one visualization are included for indexing, while dashboards with only one visualization are not. However, you can enable or disable it at any time and save the page. |
Import |
Imports the selected dashboard from OpenSearch Dashboards into the PeopleSoft database. If you modify a dashboard after it has been imported to PeopleSoft, you should re-import the dashboard to PeopleSoft. |
Save |
Saves the imported dashboard in the PeopleSoft database. |
Add to Project |
Enables you to add data set instances on the page to an existing or new ADS project. |
After importing the dashboard to the PeopleSoft database, the user with the Search Administrator role can configure the dashboard as a tile or related information in a component to enable end users to use the dashboard directly from PeopleSoft.
Note: In addition to the Search Administrator role, you must also have the Portal Administrator role, which is needed to create content references.
Use the Configure Insights Dashboards page to configure dashboards as tiles or related information in a component.
Access the Configure Insights Dashboards page by selecting .
Configuring a Dashboard as a Tile
Search Framework provides the Configure Insights Dashboards page to enable you to create a content reference for a tile. In order to use this dashboard, end users should add the tile to their PeopleSoft home page using the personalizations option.
For more information, see Using a Dashboard.
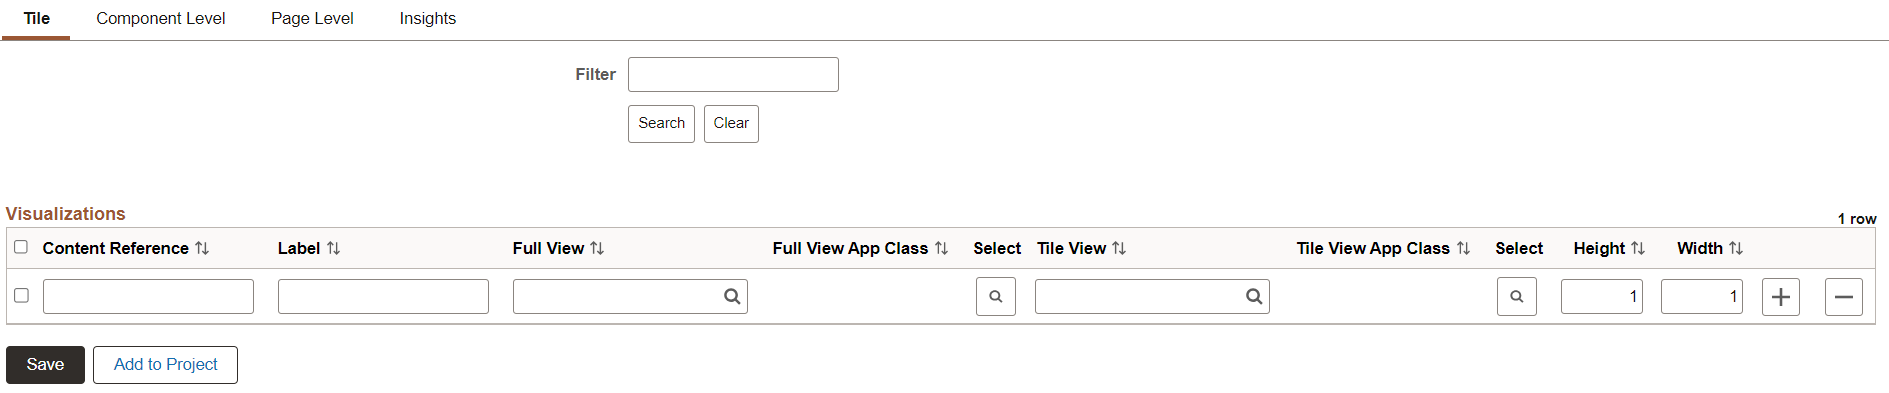
This example illustrates the fields and controls on the Configure Insights Dashboards - Tile tab. You can find definitions for the fields and controls later on this page.
Field or Control |
Description |
|---|---|
Content Reference |
Enter a unique name for the content reference of the tile. For example, JOB_POSTINGS_TILE. This name is not displayed to the end user. Before you enter a name for a content reference, refer to Defining Content References. The content reference is stored in the PeopleSoft Applications folder at this location: . |
Label |
Enter a label for the tile. For example, Job Postings. The label appears as the tile header. |
Full View |
Choose an imported dashboard from the list. You may configure a dashboard with multiple visualizations for full view. This is a mandatory field. When a dashboard displays in full view in PeopleSoft, the Open in OpenSearch Dashboards link displays if the edit privilege for the dashboard is assigned to you on the Insights Privileges page. The Open in OpenSearch Dashboards link enables you to open the dashboard in OpenSearch Dashboards and edit the dashboard. A user with the view privilege can open the dashboard in PeopleSoft where you have options to filter the data or use the time picker to view data based on a time range. See Specifying User Privileges for more information. |
Full View App Class |
Choose an application class that contains PeopleCode to apply filters based on context and display visualization data accordingly. For more information, see Specifying an Application Class section later in this topic. If you do not specify an application class to filter data, OpenSearch Dashboards displays the default visualization data. |
Select |
Select to launch the Full View page to choose an application class. For more information, see Specifying an Application Class section later in this topic. |
Tile View |
Choose an imported dashboard from the list. When you configure a dashboard as tile view, the configured dashboard displays on the loading of the tile. This is a mandatory field. Note: Oracle recommends that you configure a dashboard that has a single visualization for tile view. |
Tile View App Class |
Choose an application class that contains PeopleCode to apply filters based on context and display visualization data accordingly. For more information, see Specifying an Application Class section later in this topic. If you do not specify an application class to filter data, OpenSearch Dashboards displays the default visualization data. |
Select |
Select to launch the Tile View page to choose an application class. For more information, see Specifying an Application Class section later in this topic. |
Height |
Specify the height of the tile. For more information on tile sizes, see Step 4: Tile Layout Properties. |
Width |
Specify the width of the tile. |
Add to Project |
Enables you to add data set instances on the page to an existing or new ADS project. |
Configuring a Dashboard as Related Information of a Component
Configuring a dashboard as related information of a component makes the dashboard appear in the right panel of the component. However, access to the component and dashboard data is controlled by the security privileges assigned to a user.
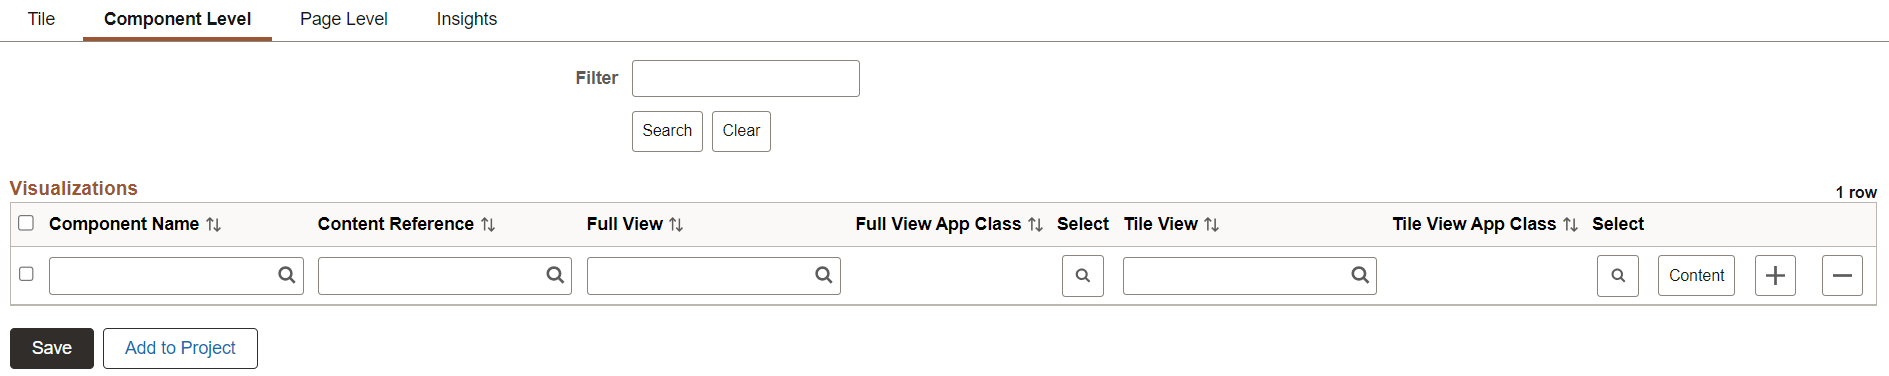
On the Configure Insights Dashboards page, select the Component Level tab to configure a dashboard as related information of a component.
This example illustrates the fields and controls on the Configure Insights Dashboards page - Component Level tab. You can find definitions for the fields and controls later on this page.
Field or Control |
Description |
|---|---|
Component Name |
Choose the fluid component to which you want to configure a dashboard as related information. |
Content Reference |
Choose the content reference name associated with the selected component. |
Full View |
Choose an imported dashboard from the list. You may configure a dashboard with multiple visualizations for full view. This is a mandatory field. When a dashboard displays in full view in PeopleSoft, the Open in OpenSearch Dashboards link displays if the edit privilege for the dashboard is assigned to you on the Insights Privileges page. The Open in OpenSearch Dashboards link enables you to open the dashboard in OpenSearch Dashboards and edit the dashboard. A user with the view privilege can open the dashboard in PeopleSoft where you have options to filter the data or use the time picker to view data based on a time range. See Specifying User Privileges for more information. |
Full View App Class |
Displays the selected application class, which contains PeopleCode to apply filters based on context and display visualization data accordingly. If you do not specify an application class to filter data, OpenSearch Dashboards displays the default visualization data. |
Select |
Select to launch the Full View page to choose an application class. For more information, see Specifying an Application Class section later in this topic. |
Tile View |
Choose an imported dashboard from the list. When you configure a dashboard as tile view, the related information tile displays the dashboard on loading of the component. Note: Oracle recommends that you configure a dashboard that has a single visualization for tile view. |
Tile View App Class |
Displays the selected application class, which contains PeopleCode to apply filters based on context and display visualization data accordingly. If you do not specify an application class to filter data, OpenSearch Dashboards displays the default visualization data. |
Select |
Select to launch the Tile View page to choose an application class. For more information, see Specifying an Application Class section later in this topic. |
Content |
Enables you to preview the dashboard in the component. |
Add to Project |
Enables you to add data set instances on the page to an existing or new ADS project. |
Specifying an Application Class
PeopleSoft provides you the flexibility to filter the data in a visualization based on a context by using an application class (PTSF_INSIGHTS) that contains PeopleCode to apply filters.
For more information on using the application classes, see FilterValues Class and DashboardFilters Class.
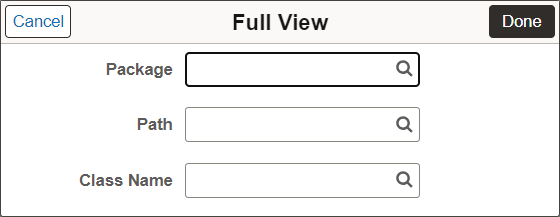
Access the Full View or Tile View page by selecting the search icon on the row.
This example illustrates the fields and controls on the Full View page. You can find definitions for the fields and controls later on this page.
Field or Control |
Description |
|---|---|
Package |
Specifies the root package where the application class is created. |
Path |
Species the path, represented by a colon (:). |
Class Name |
Choose the relevant application class. You must ensure that you choose the correct application class; if not an error message is displayed. |
Embedding a Dashboard in Applications Page
On the Configure Insights Dashboards page, select the Page Level tab to embed a dashboard in applications page.
Before you embed a dashboard, you must ensure that the prerequisite for embedding a dashboard in applications page is completed. You need to complete the following steps:
Open the applications page in Application Designer.
Insert an Embedded Related Content group box.
See Setting Group Box Properties and Working with Embedded Related Content.
In the Fluid tab of the Group Box Properties page, select Related Content as Group Box Type.
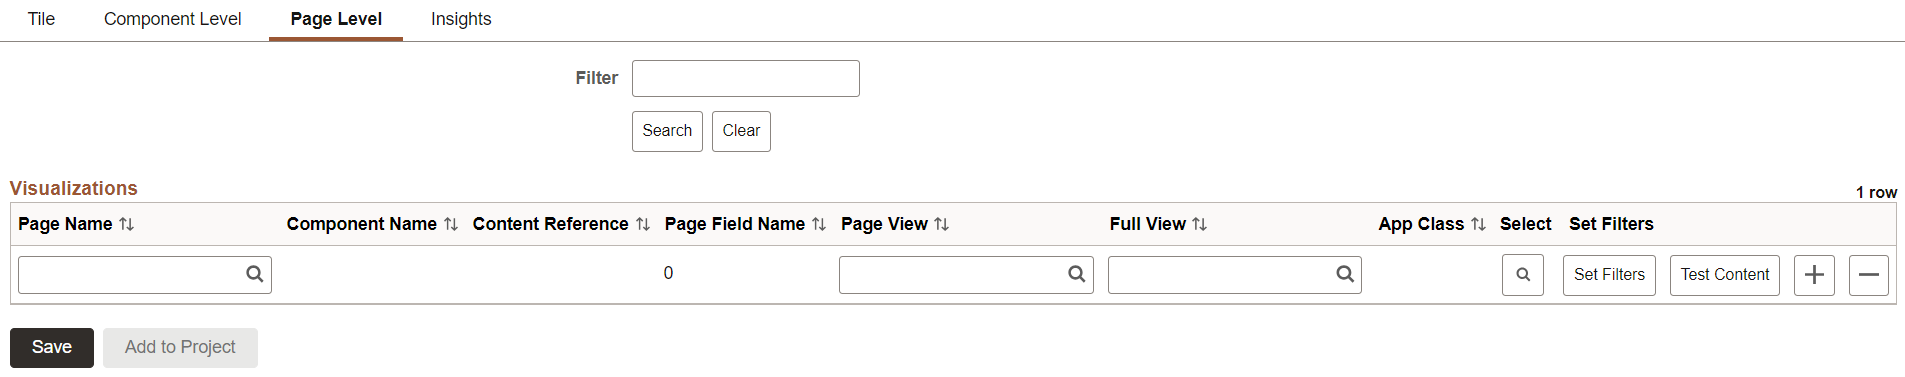
This example illustrates the fields and controls on the Configure Insights Dashboards - Page Level tab. You can find definitions for the fields and controls later on this page.
|
Field or Control |
Description |
|---|---|
|
Page Name |
Choose the applications page where you want to embed a dashboard. |
|
Component Name |
Choose the component name associated with the selected page. |
|
Content Reference |
Choose the content reference name associated with the selected component. |
|
Page Field Name |
Choose the page field name associated with the ERC group box. |
|
Page View |
Choose an imported dashboard from the list. When you embed a dashboard as a page view, the dashboard is displayed on loading of the applications page. |
|
Full View |
Choose an imported dashboard from the list. You may embed a dashboard with multiple visualizations for full view. This is a mandatory field. When a dashboard displays in full view in PeopleSoft, the Open in OpenSearch Dashboards link displays if the edit privilege for the dashboard is assigned to you on the Insights Privileges page. The Open in OpenSearch Dashboards link enables you to open the dashboard in OpenSearch Dashboards and edit the dashboard. A user with the view privilege can open the dashboard in PeopleSoft where you have options to filter the data or use the time picker to view data based on a time range. See Specifying User Privileges for more information. |
|
App Class |
Displays the selected application class, which contains PeopleCode to apply filters based on context and display visualization data accordingly. If you do not specify an application class to filter data, OpenSearch Dashboards displays the default visualization data. |
|
Select |
Select to launch the Tile View page to choose an application class. For more information, see Specifying an Application Class section later in this topic. |
|
Set Filters |
Select to launch the Set Filters page to apply additional filters apart from the time range. For more information, see Specifying Set Filters section later in this topic. |
|
Test Content |
Enables you to preview the dashboard in the applications page. |
|
Add to Project |
Enables you to add data set instances on the page to an existing or new ADS project. |
Specifying Set Filters
PeopleSoft provides you the flexibility to filter the data in a visualization based on a context by using an application class (PTSF_INSIGHTS) that contains PeopleCode to apply filters apart from time range. Page field values can be used as filters. On the dashboard that is rendered, the applied filters are shown.
Note: Set Filters can be configured for a maximum of three page field values.
Access the Set Filters page by selecting the Set Filters button on the row.
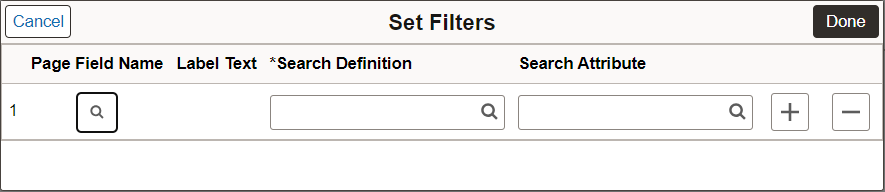
This example illustrates the fields and controls on the Set Filters page. You can find definitions for the fields and controls later on this page.
|
Field or Control |
Description |
|---|---|
|
Page Field Name |
Choose the page field (in the applications page) which you want to apply as filter in the dashboard. |
|
Label Text |
Displays the labels of the Page Field Name. |
|
Search Definition |
Choose the search definition to which you want to apply the filter. |
|
Search Attribute |
Choose the search attribute to which you want to apply the filter. |
Once you embed the dashboard, you can view the applied filters in your visualization. This allows you to refresh the visualization based on the filter values applied at runtime using the Refresh button. You can also change the dashboard at runtime based on your requirements using the delivered PeopleCode methods. For more information, see FilterValues Class Methods.
When you click the tile view visualization, a full view dashboard appears in the new window.
Embedding a Dashboard in Fluid WorkCenter
On the Configure Insights Dashboards page, select the Insights tab to embed a dashboard in fluid WorkCenter pages.
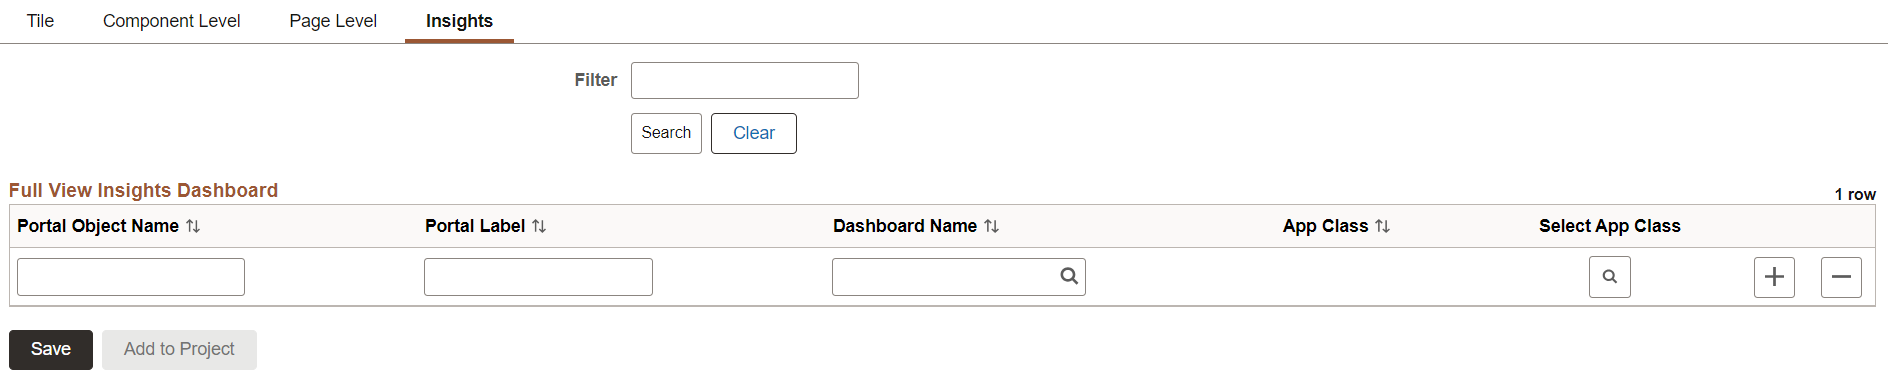
This example illustrates the fields and controls on the Configure Insights Dashboards - Insights tab. You can find definitions for the fields and controls later on this page.
|
Field or Control |
Description |
|---|---|
|
Portal Object Name |
Enter the portal object name. |
|
Portal Label |
Enter the label for portal. |
|
Dashboard Name |
Choose an imported dashboard from the list. |
|
App Class |
Displays the selected application class, which contains PeopleCode to apply filters based on context and display visualization data accordingly. If you do not specify an application class to filter data, OpenSearch Dashboards displays the default visualization data. |
|
Select App Class |
Select to launch the Full View page to choose an application class. For more information, see Specifying an Application Class section. |
|
Add to Project |
Enables you to add data set instances on the page to an existing or new ADS project. |
After you embed a dashboard in Fluid WorkCenter page, you can associate the newly created Insights CREF with your Fluid WorkCenter. Use the Configure Pagelets page to create links and activate the links for the CREF.
For more information, see PeopleSoft HCM 9.2: Application Fundamentals, “Understanding PeopleSoft Fluid WorkCenters”.
Use the following steps to associate a new CREF to Fluid WorkCenter using the Configure Pagelets page:
Select .
Choose the Fluid WorkCenter to which you want to associate the new CREF.
Associate the new CREF to Fluid WorkCenter.
After you add the new CREF, activate the link.
Save the page.
For more information, see PeopleSoft HCM 9.2: Enterprise Components, “Configuring Pagelets”.
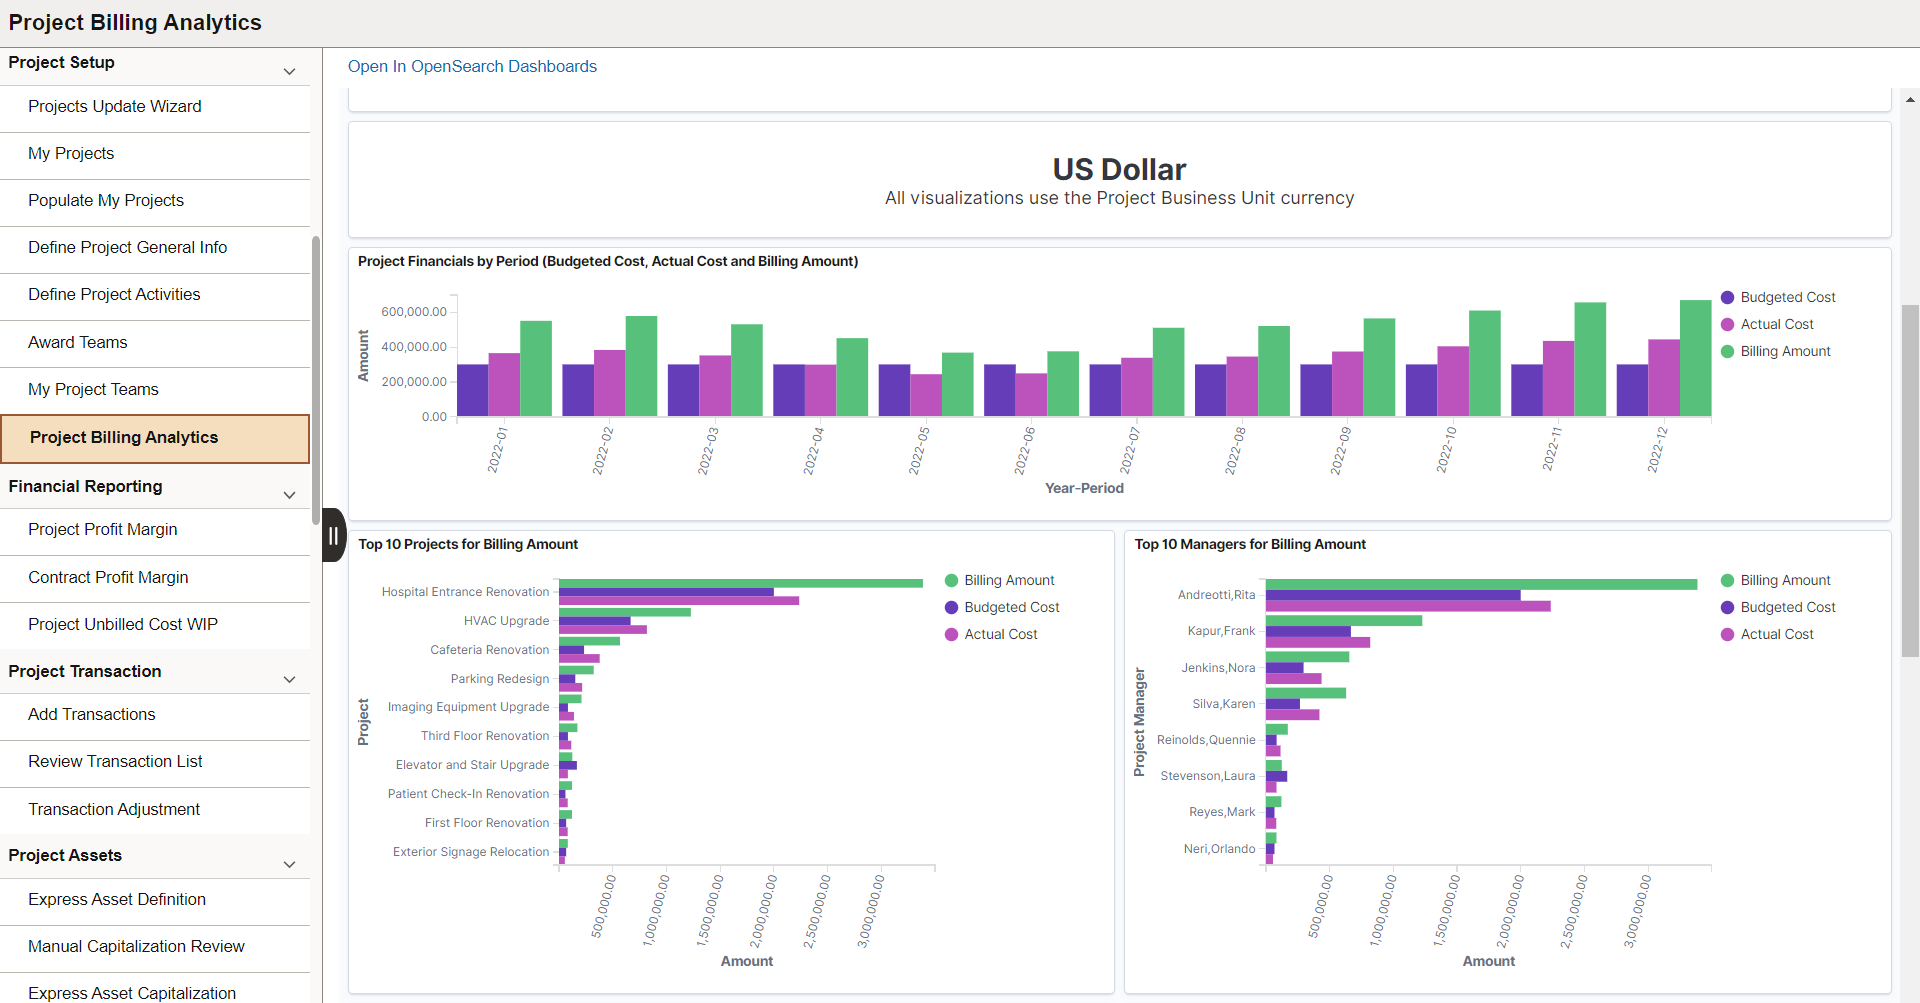
This example illustrates the Fluid WorkCenter after you integrate a dashboard.
OpenSearch Dashboards does not provide role level access to the dashboards and visualizations, so PeopleSoft provides the required security by mapping the dashboards to PeopleSoft roles.
Note: The Search Administrator role is considered as the super user in OpenSearch Dashboards. Thus, a user with the Search Administrator role has access to all the dashboards and visualizations. However, the Search Administrator role does not have access to the data in OpenSearch Dashboards. Access to the data is controlled by the application-specific roles. If a user does not have access to the data, the visualization displays the message: No results found.
Use the Insights Privileges page to specify user privileges for the dashboards and to create visualizations.
Access the Insights Privileges page by selecting .
This example illustrates the fields and controls on the Insights Privileges page. You can find definitions for the fields and controls later on this page.
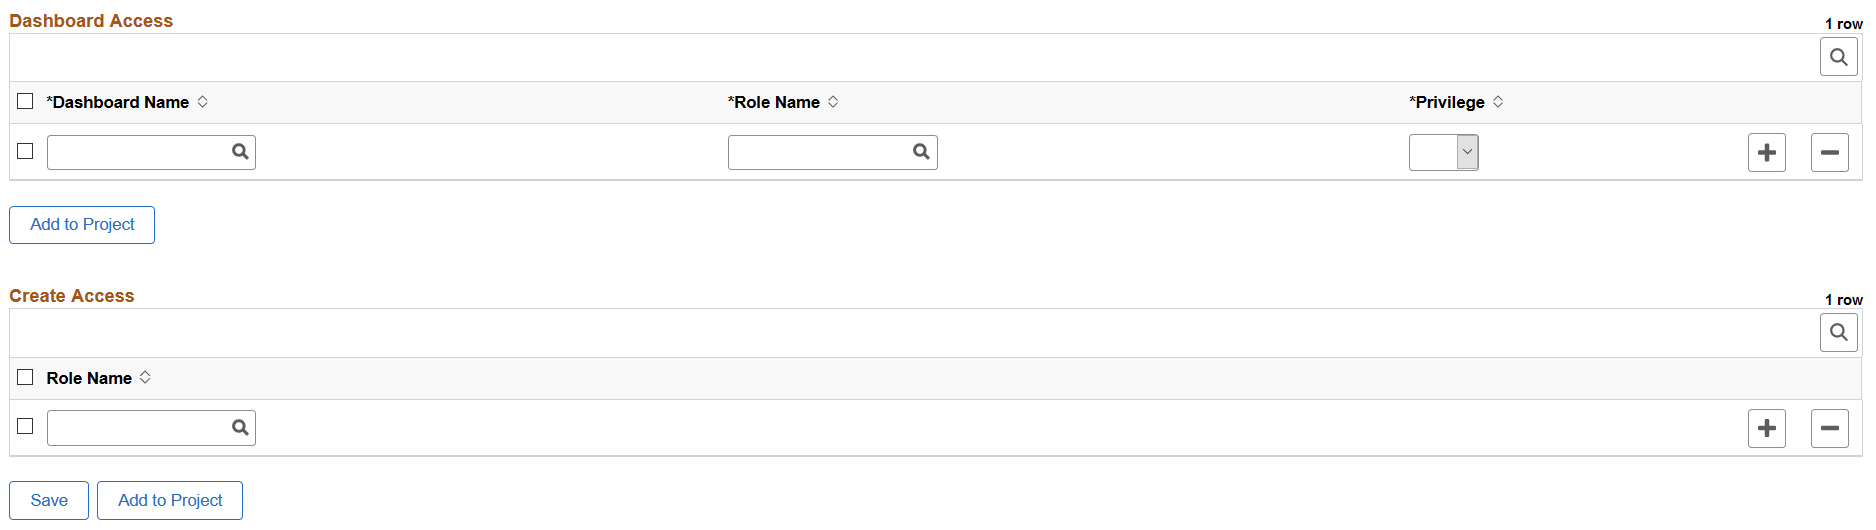
Dashboard Access Grid
|
Field or Control |
Description |
|---|---|
|
Dashboard Name |
The drop-down list displays the imported dashboards. Choose a dashboard. |
|
Role Name |
Choose an application specific role that you want to map to the selected dashboard. The application-specific role enables a user to access and view data in OpenSearch Dashboards. |
|
Privilege |
Valid values are:
With this security layer, only users with the specified role can view or edit a dashboard. Furthermore, if you want to personalize a tile (dashboard) on your home page, the tile will be listed only if you have the privilege, that is, you have the role specified on the Insights Privileges page. Therefore, administrators must take into account the users to whom the dashboards should be available. |
Create Access Grid
|
Field or Control |
Description |
|---|---|
|
Role Name |
For a user to create a new dashboard, the user should have at least one of the access roles mapped in the create access list. A user who is the creator of the dashboard possesses the edit privilege irrespective of the role mapped in the dashboard create access grid. A user with the Search Administrator role can access all the dashboards. |
|
Add to Project |
Enables you to add data set instances on the page to an existing or new ADS project. |
A dashboard can be mapped to multiple roles with different privileges for a user.